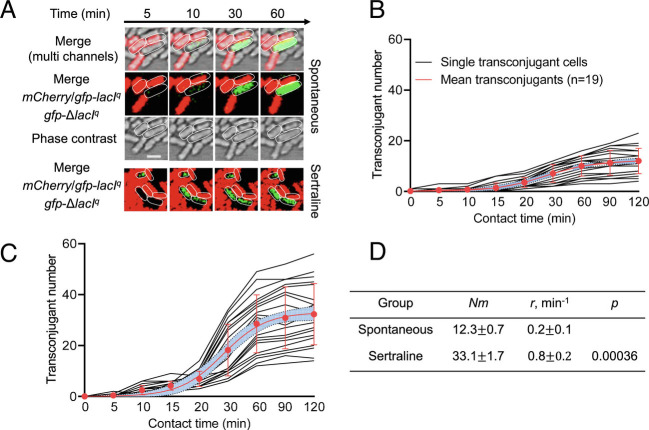
Fig. 7.
Real-time visualization of conjugative transfer by gfp-encoded pKJK5 plasmid. (A) Time-lapse microscopic images of conjugative transfer performed in a microfluidic chamber without antidepressant (spontaneous) or under the exposure of 10 mg/L sertraline. (B) Single-cell time-lapse quantification of transconjugant (green-fluorescent cell) number in the control group (without antidepressant). (C) Single-cell time-lapse quantification of transconjugant in the sertraline-exposed group. (D) Model fitting results of B and C. Nm is the predicted maximum transconjugant number, and r is the rate of conjugative transfer (transconjugants per minute). For B and C, each black line represents transconjugant number generated at different time points. The red line is the fitting curve of all black lines with standard deviations. The violet area is the 95% CI.

