Figure 3.

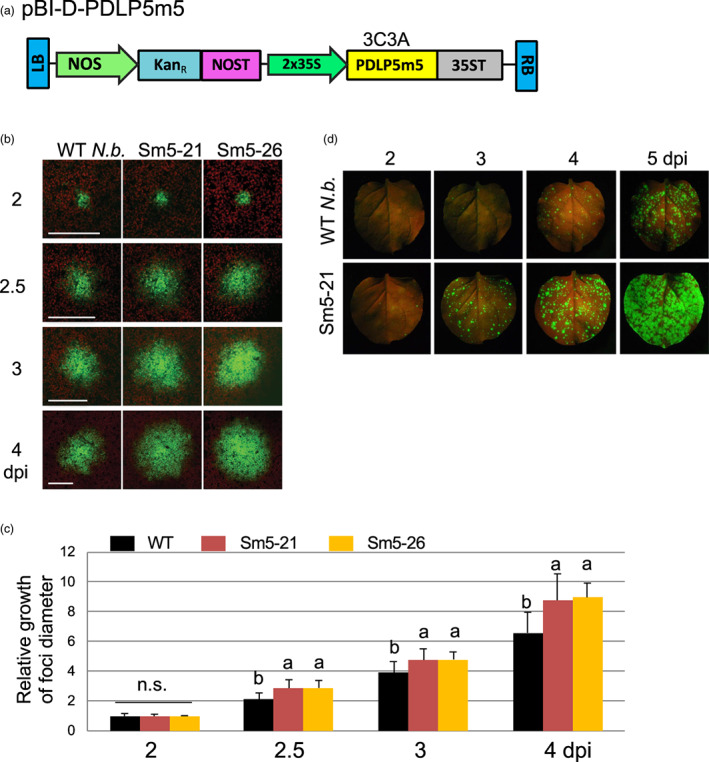
Transgenic Sm5 (3C3A) plants facilitate cell‐to‐cell viral movement. (a) Schematic representation of the T‐DNA portion of the plasmid pBI‐D‐PDLP5m5. LB and RB, left and right T‐DNA borders, respectively. NOS and NOST, Agrobacterium nopaline synthase promoter and terminator, respectively. KanR, neomycin phosphotransferase II, conferring resistance to kanamycin. 2x35S, two tandemly ordered Cauliflower mosaic virus 35 S promoters with the Tobacco etch virus leader sequence. 35ST, Cauliflower mosaic virus 35 S terminator. (b) Representative confocal images showing TMV‐GFP foci growth in select Sm5 lines compared to WT. The agrobacterial suspension was diluted to OD600nm = 0.001. Ten foci were selected for monitoring per line from multiple plant samples. Size bars, 100 μm. (c) Quantitative results of the foci growth assays. At least 10 foci selected from multiple plants were monitored per genetic background in each experiment and the experiments were repeated at least two times. Error bars, standard deviation. Levels not connected by the same letters are significantly different at α = 0.05 according to the LSD test following one‐way ANOVA. n.s., no significance. (d) Representative photographs showing TMV‐GFP foci development in Sm5‐21 compared to WT N.b. leaves. Mature leaves of 4‐week‐old plants were agro inoculated by infiltrating them with the agrobacterial suspension diluted to OD600nm = 0.001. Following agroinfiltration, the development of TMV‐GFP foci per leaf was monitored for 5 days following inoculation. Photos were taken under a BlackRay UV lamp using a D3500 Nikon camera.
