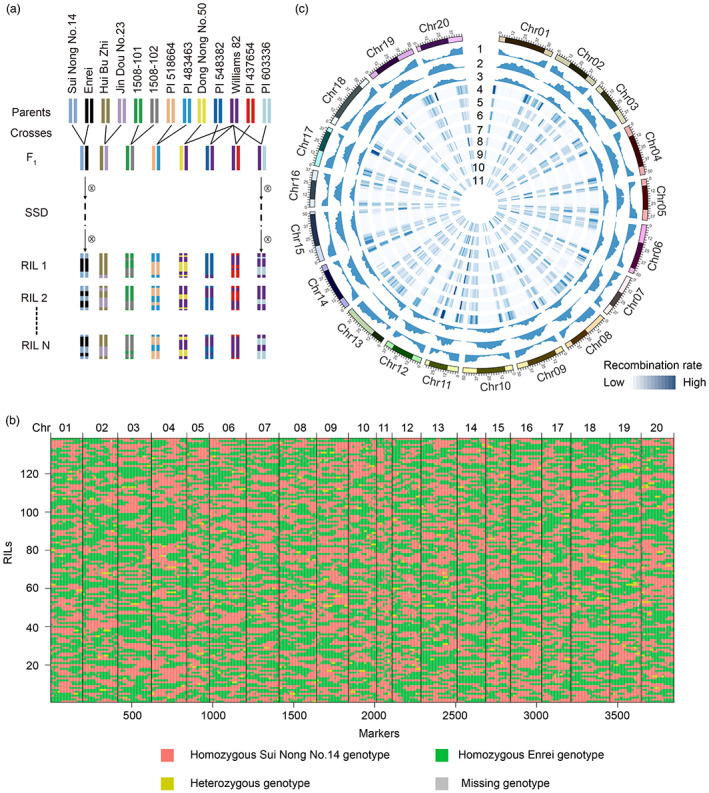
Figure 2.

Overview of meiotic recombination in soybean RIL populations. (a) Construction of eight soybean RIL populations. Different colours represent various parental genotypes. SSD, single‐seed descent. (b) Recombination map of Sui Nong No.14 × Enrei. The colour red represents the homozygous Sui Nong No.14 genotype, green indicates the homozygous Enrei genotype, yellow represents the heterozygous genotype, and grey indicates a missing genotype. (c) Recombination landscape in the soybean genome. Tracks from outer to inner circles represent the distribution of gene density (1), TE density (2), GC content (3) and recombination rate for eight soybean RIL populations (4‐11), including Sui Nong No.14 × Enrei (4), Hui Bu Zhi × Jin Dou No.23 (5), 1508‐101 × 1508‐102 (6), PI 518664 × PI 483463 (7), Dong Nong No.50 × Williams 82 (8), PI 548382 × Williams 82 (9), PI 437654 × Williams 82 (10) and PI 603336 × Williams 82 (11). The black blocks indicate pericentromeric regions.
