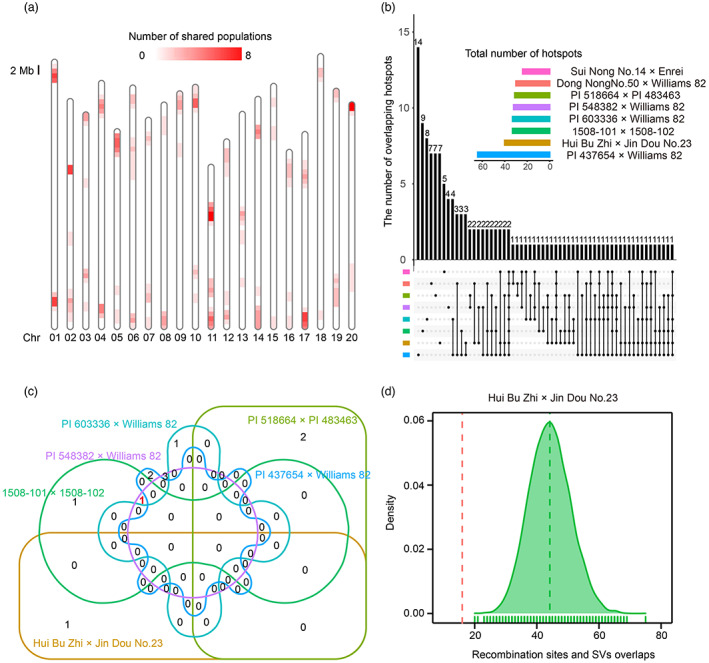
Figure 3.

Genome‐wide and local recombination rate variation in the soybean genome. (a) The distribution of recombination hotspots identified from eight soybean RIL populations in the soybean genome. The gradient colours from white to red indicate an increasing number of RIL populations shared by a given hotspot. (b) Upset plot demonstrating the intersection of recombination hotspots between different RIL populations. Horizontal bars represent total number of recombination hotspots detected in each RIL population; numbers above vertical bars represent the count of hotspots shared by a given intersection of various RIL populations. (c) QTLs for recombination hotspot usage shared by eight RIL populations. Red number indicates the number of QTLs detected in two RIL populations (PI 548382 × Williams 82 and 1508‐101 × 1508‐102). (d) Overlaps between recombination events and SVs in the Hui Bu Zhi × Jin Dou No.23 population. The red dashed line indicates average number of overlaps between observed recombination events and SVs. The green dashed line represents the average number of overlaps between SVs and random recombination events that matched the distributions of observed recombination events.
