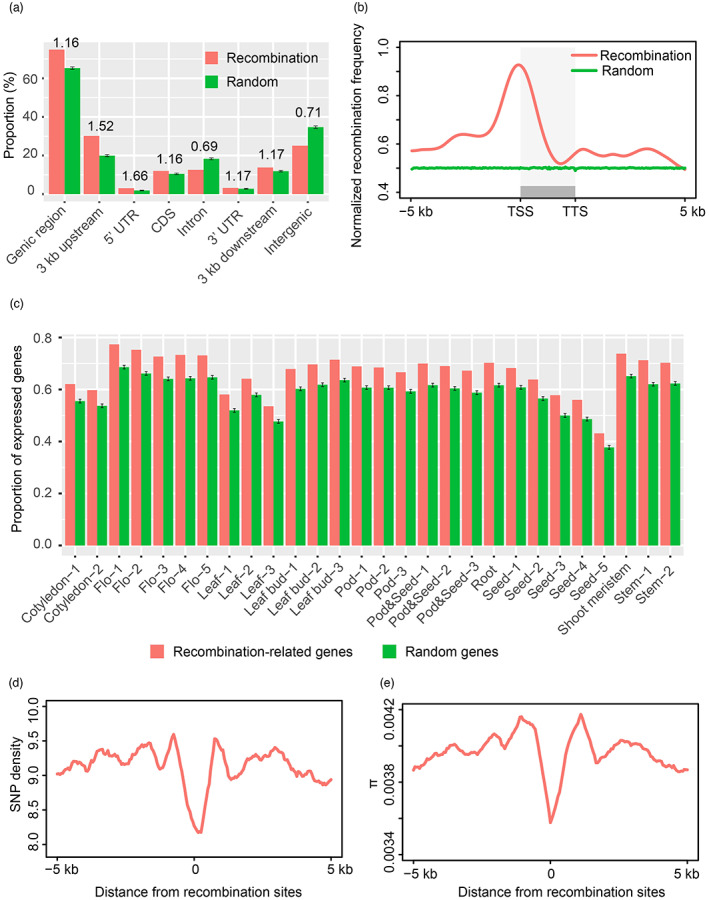
Figure 4.

Relationship of fine‐scale genomic features with high‐resolution recombination events in soybean. (a) Association of high‐resolution recombination events with different genomic features against random sets (permutation tests). Error bars indicate the standard deviation of 10 000 permutation tests. Genic region includes 3 kb upstream of a gene start, 5′ UTR, CDS, intron, 3′ UTR and 3 kb downstream of a gene end. The number above vertical bars represents the ratio of high‐resolution recombination events to random sites. The midpoint of a high‐resolution recombination interval was used to calculate the number of overlap with genomic features. (b) The distribution of recombination frequency relative to all protein‐coding genes in soybean. TSS, transcription start site. TTS, transcription termination site. (c) Comparisons of the proportion of expressed genes between recombination‐related gene set and randomly selected gene set. Genes with FPKM values >0.5 were considered as expressed genes. Error bars indicate the standard deviation of 10 000 permutations for random genes. (d) The distribution of SNP density across high‐resolution recombination sites and in flanking 5 kb regions. (e) Nucleotide diversity distribution across high‐resolution recombination sites and in flanking 5 kb regions.
