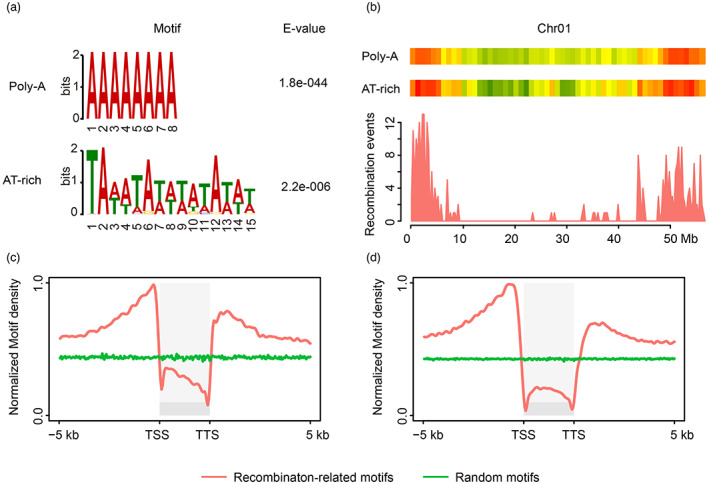
Figure 5.

DNA motifs identified in the vicinity of high‐resolution recombination sites. (a) Enrichment of poly‐A and AT‐rich motifs was found in high‐resolution recombination intervals using MEME. (b) The distribution of the two motifs and high‐resolution recombination events on chromosome 1. (c, d) The distribution of Poly‐A (c) and AT‐rich (d) motifs over transcription units and their flanking regions. TSS, transcription start site. TTS, transcription termination site. Red lines indicate the distribution of recombination‐related motifs over gene bodies and their flanking regions. Green lines represent the distribution of random motifs via simulation.
