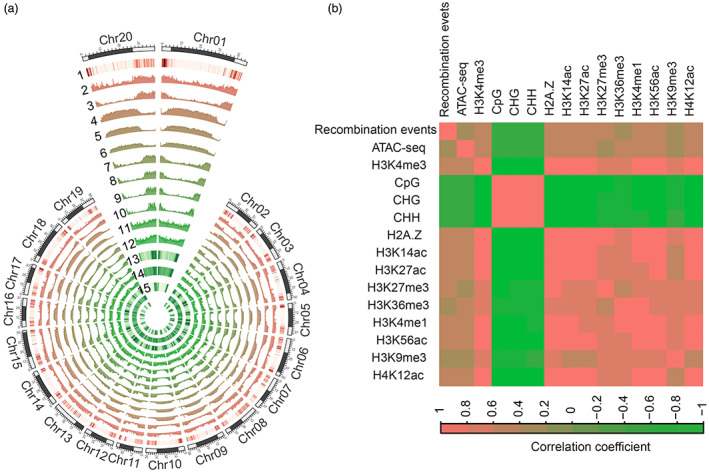
Figure 6.

Relationship between recombination events and epigenetic modifications at the chromosome level. (a) Circos plot of high‐resolution recombination events and epigenetic modifications. Tracks from outer to inner circles represent the distribution of high‐resolution recombination events (1), ATAC‐seq (2), H3K4me3 (3), CpG (4), CHG (5), CHH (6), H2A.Z (7), H3K14ac (8), H3K27ac (9), H3K27me3 (10), H3K36me3 (11), H3K4me1 (12), H3K56ac (13), H3K9me3 (14) and H4K12ac (15). Reads counts and DNA methylation levels were counted based on the non‐overlapping 200 kb genomic regions. The black blocks indicate pericentromeric regions. (b) Correlation coefficient heatmap for recombination events with chromatin accessibility and epigenetic modifications.
