Figure 7.

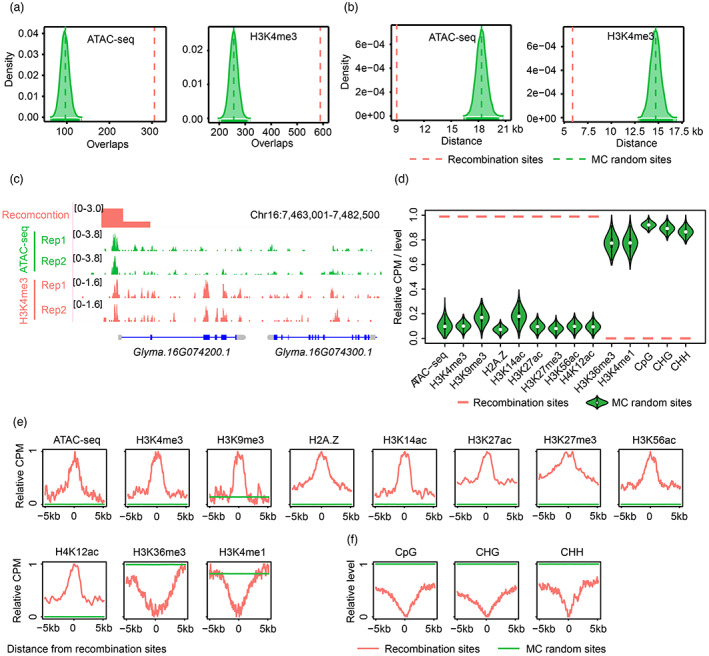
Fine‐scale epigenomic features are associated with high‐resolution recombination events in soybean. (a) Overlap analyses for accessible chromatin regions (ACRs) and H3K4me3 peaks with recombination sites. Red dashed lines indicate the average number of overlaps between observed high‐resolution recombination events and ACRs or H3K4me3 peaks. Green dashed lines indicate the average number of overlaps between randomly sampled sites and ACRs or H3K4me3 peaks. (b) The shortest distance from recombination sites to ACRs and H3K4me3 peaks. Red dashed lines indicate the average value of the shortest distance from recombination sites to ACRs or H3K4me3 peaks. Green dashed lines indicate the average value of the shortest distance from randomly sampled sites to ACRs or H3K4me3 peaks. (c) An ACR and an H3K4me3 peak co‐localized with recombination events in regions near the transcription start site (TSS) of Glyma.16G074200.1. (d) Epigenetic status across high‐resolution recombination sites and randomly selected sites. Total read counts or methylation level for 2 kb genomic regions centred on recombination sites were compared to random sites. CPM, counts per million. (e) The distribution of normalized read counts for ATAC‐seq, different histone modifications and histone variant H2A.Z across recombination sites and in flanking regions compared to random sites. (f) Average profiles of normalized DNA methylation levels across recombination sites and in their flanking regions compared to random sites.
