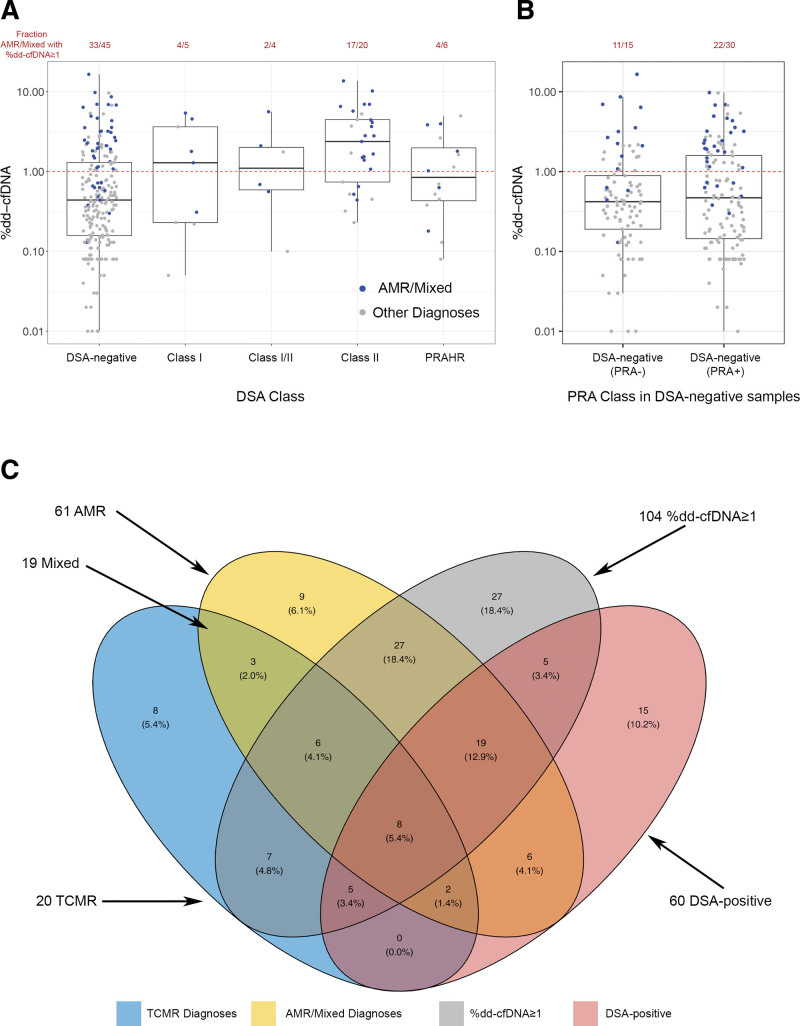
FIGURE 2.
Relationships between MMDx rejection categories, DSA and %dd-cfDNA. A, Boxplots showing the distribution of %dd-cfDNA values across central DSA categories. Boxes represent the interquartile ranges and horizontal lines the medians. B, DSA-negative category split into PRA-positive and PRA-negative categories. C, Venn diagram showing overlap of samples with Molecular Microscope Diagnostic System TCMR, ABMR, %dd-cfDNA ≥1, and DSA positivity. Samples with mixed rejection are in the intersection between AMR and TCMR. One hundred thirty-three of the 280 samples have none of the 4 features and are therefore outside of the ellipses. AMR, antibody-mediated rejection; dd-cfDNA, donor-derived cell-free DNA; DSA, donor-specific antibody; PRA, panel-reactive antibody; PRAHR, panel-reactive antibody–high risk; TCMR, T cell–mediated rejection.

