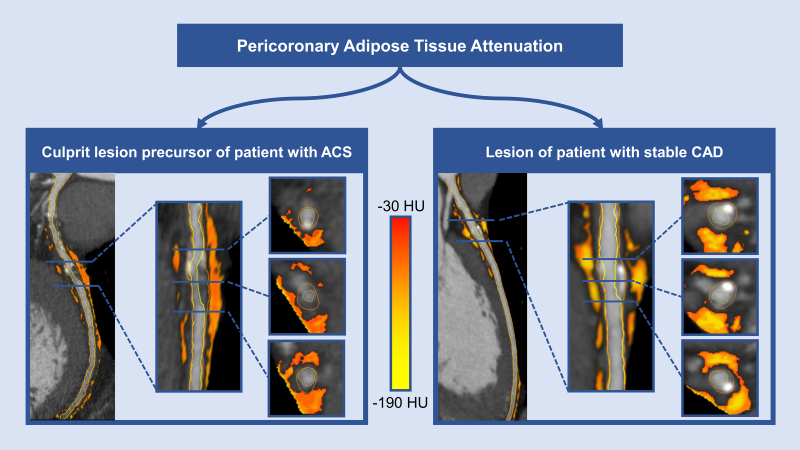
Figure 1.
Pericoronary adipose tissue (PCAT) attenuation on computed tomography angiography (CCTA). Multiplanar reconstructions of CCTA scans showing mixed plaques in the proximal (right) and middle (left) left anterior descending coronary artery, with surrounding pericoronary adipose tissue (orange-yellow colored areas) across a precursor of a culprit lesion of a patient who developed an ACS (left) and across a lesion of a patient with stable CAD (right). ACS indicates acute coronary syndrome; CAD, coronary artery disease; and HU, Hounsfield units.

