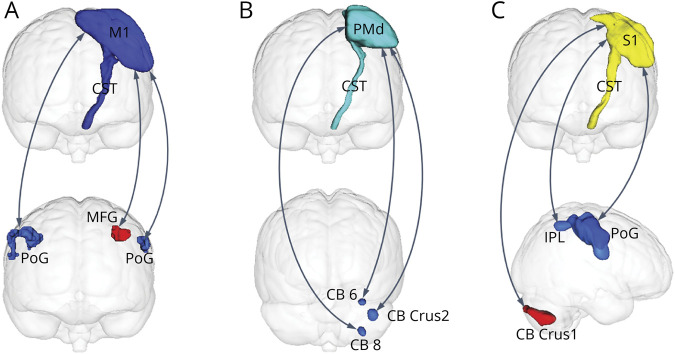
Figure 3. Pathway-Specific Covariations of CSTs and FC in Patients With Stroke.
Pathway-specific covariations of CSTs and FC originating from the ipsilesional (left) M1 (A), PMd (B), and S1 (C), respectively (p < 0.05, corrected). The double arrow lines denote altered functional connections. Blue clusters indicate with which regions the FC decreased, and red clusters indicate with which regions the FC increased. CB = cerebellum; CST = corticospinal tract; FC = functional connectivity; IPL = inferior parietal lobe; M1 = primary motor cortex; MFG = middle frontal gyrus; PoG = postcentral gyrus; PMd = dorsal premotor cortex; S1 = primary somatosensory cortex; IPL = inferior parietal lobe.

