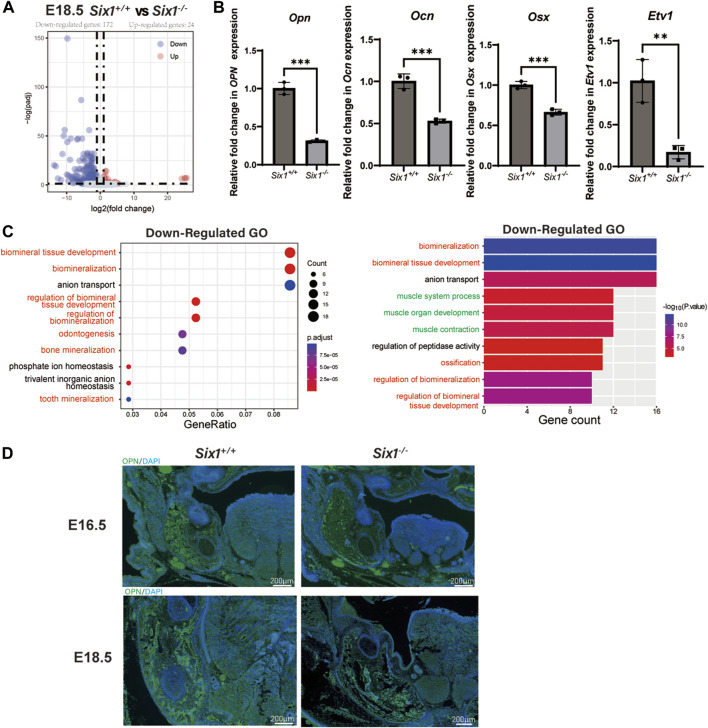
FIGURE 3.
RNA-seq of the mandibular tissue from E18.5 Six1 −/− and Six1 +/+ embryos. (A) Volcano plots show differentially expressed genes between Six1 −/− and Six1 +/+ mandibular samples. (B) RT-qPCR analysis of Opn, Ocn, Osx and Etv1 in Six1 −/− and Six1 +/+ mandibular tissues at E18.5. (C) GO enrichment analysis of genes significantly downregulated in Six1 −/− mandible. (D) Immunofluorescence staining of OPN in mandible of Six1 −/− and Six1 +/+ embryos at E16.5 and E18.5.

