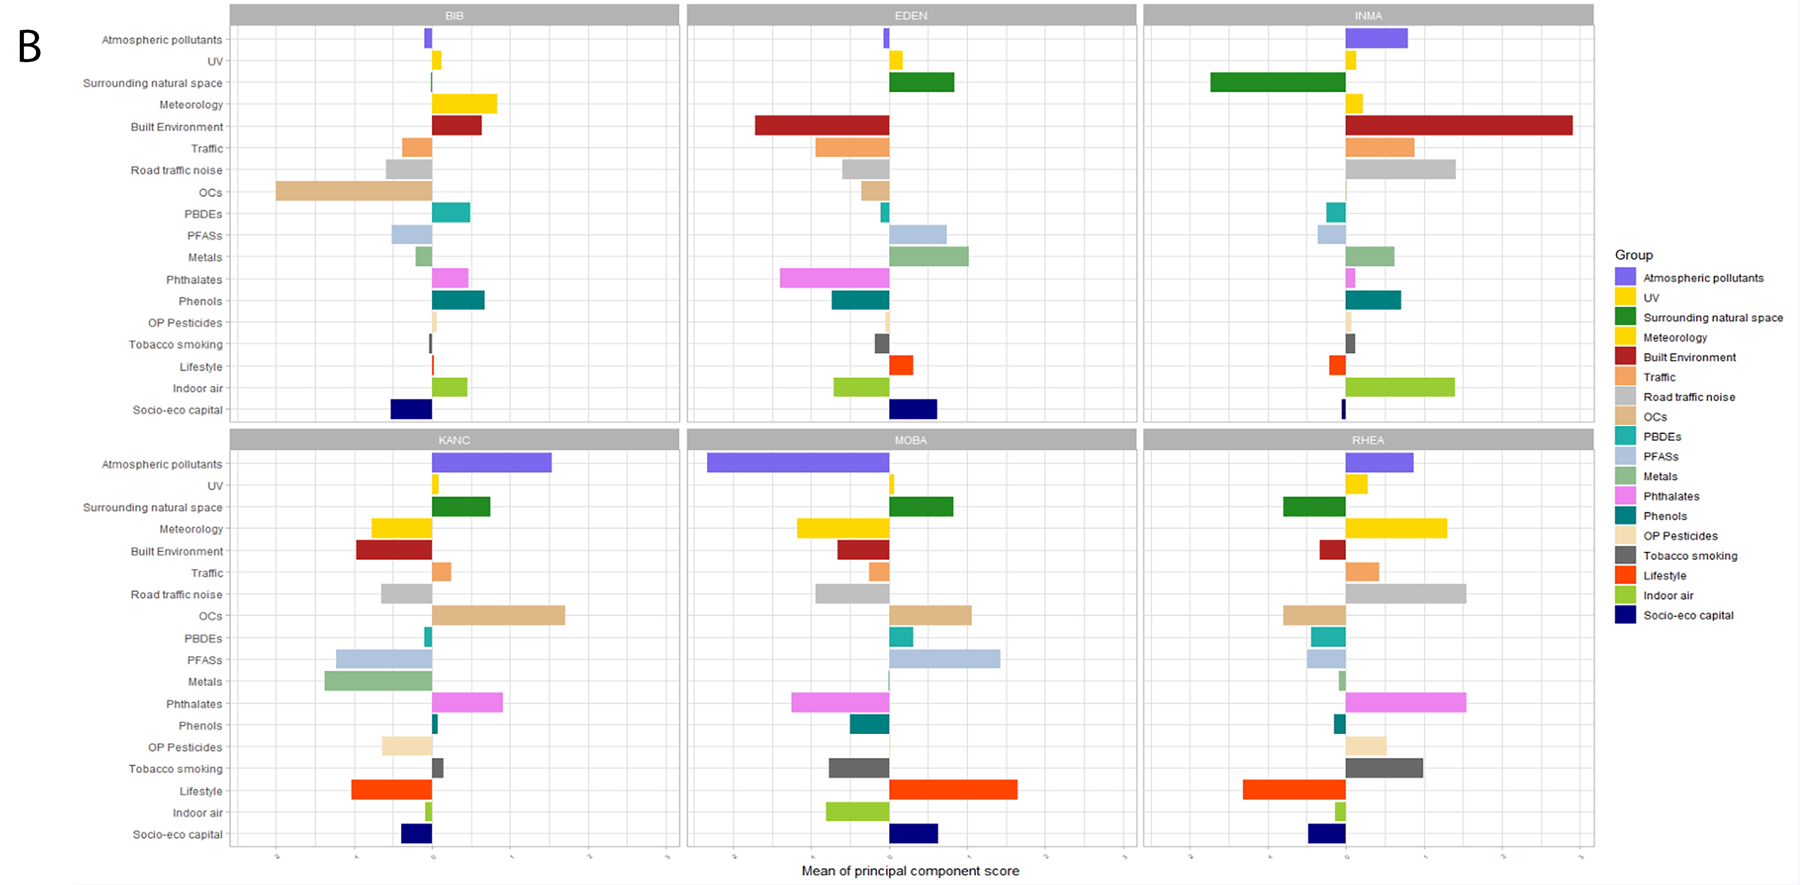
Figure 1. Profile of pregnancy* (A) and childhood** (B) exposures in the 6 cohorts according to the first component identified by PCA applied separately to each exposure group. Positive values indicate values above the overall mean, while negative values indicate values below the overall mean.


The loadings of each PCA analyses for all exposures are presented in Tables A.4.2 and A.4.3 in Annex 4. The exposures with highest loadings in each component were the following:
*For the pregnancy period (exposure, loading): atmospheric pollutants (NO2, 0.95), surrounding natural space (green spaces, 0.99), meteorology (temperature, 0.94), built environment (facility richness, 0.94), traffic (inverse distance, 0.99), OCs (PCB180, 0.93), PBDEs (PBDE47, 0.99), PFASs (PFHXS, 0.92), metals (As, 0.8), phthalates (MEOHP, 0.93), phenols (ETPA, 0.95), OP pesticides (DMP, 0.93), tobacco smoking (Cotinine, 0.96), water DBPs (brominated THMs, 0.94), lifestyle (fruit 0.69).
**For the childhood period (exposure, loading): atmospheric pollutants (PM2.5 0.87), surrounding natural space (NDVI school, 0.92), meteorology (temperature 0.93), built environment (population density, 0.89), traffic (inverse distance, 0.95), road traffic noise (noise all day, 0.33), OCs (PCB180, 0.97), PBDEs (PBDE153, 0.98), PFASs (PFUNDA, 0.92), metals (As, 0.96), phthalates (MEHHP, 0.97), phenols (PRPA, 0.91), OP pesticides (DMP, 0.96), tobacco smoking (ETS, 0.96), lifestyle (KIDMED score, 0.80), indoor air (indoor PM2.5, 0.96), socio-eco capital (social participation, 0.99).
