
Figure 3. Network visualization of the exposome.
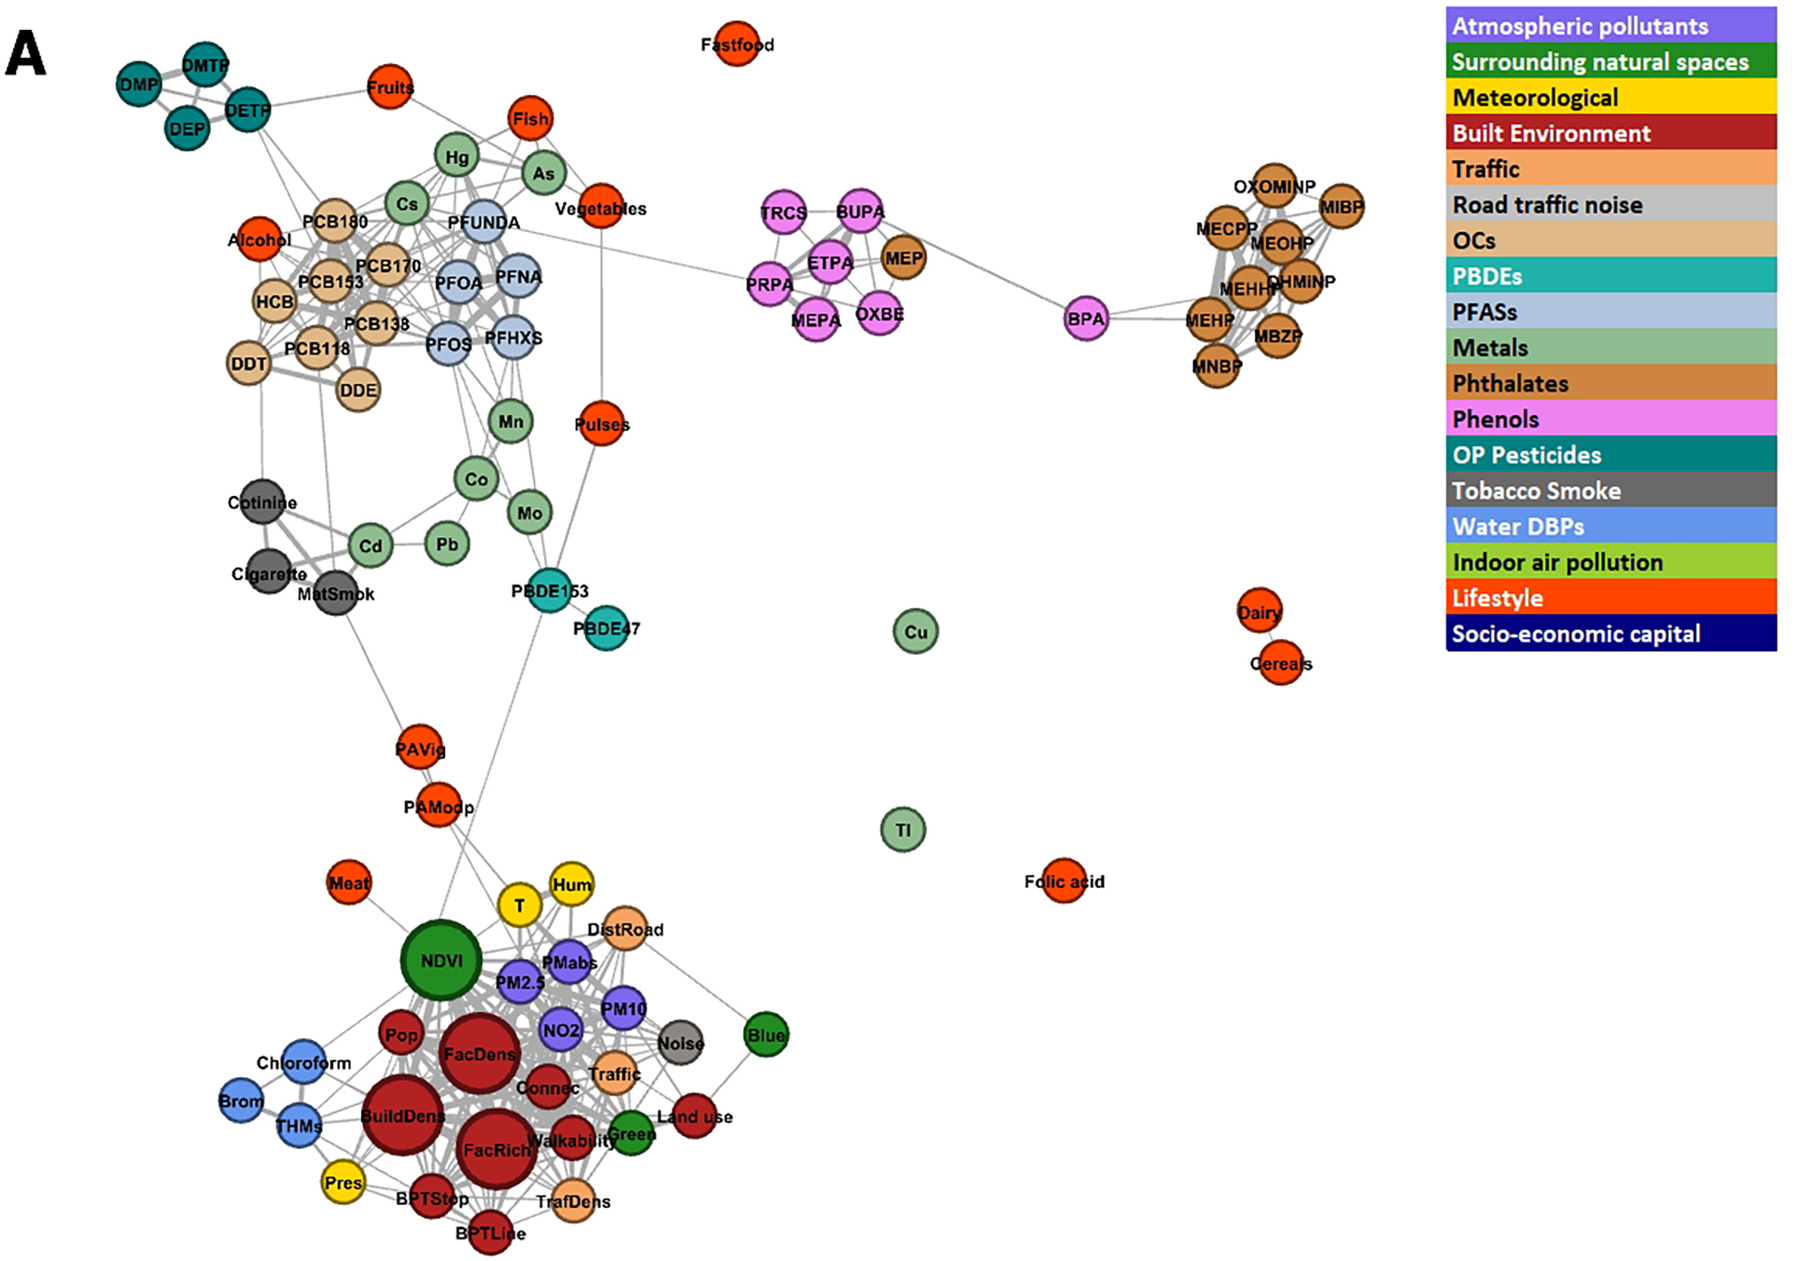
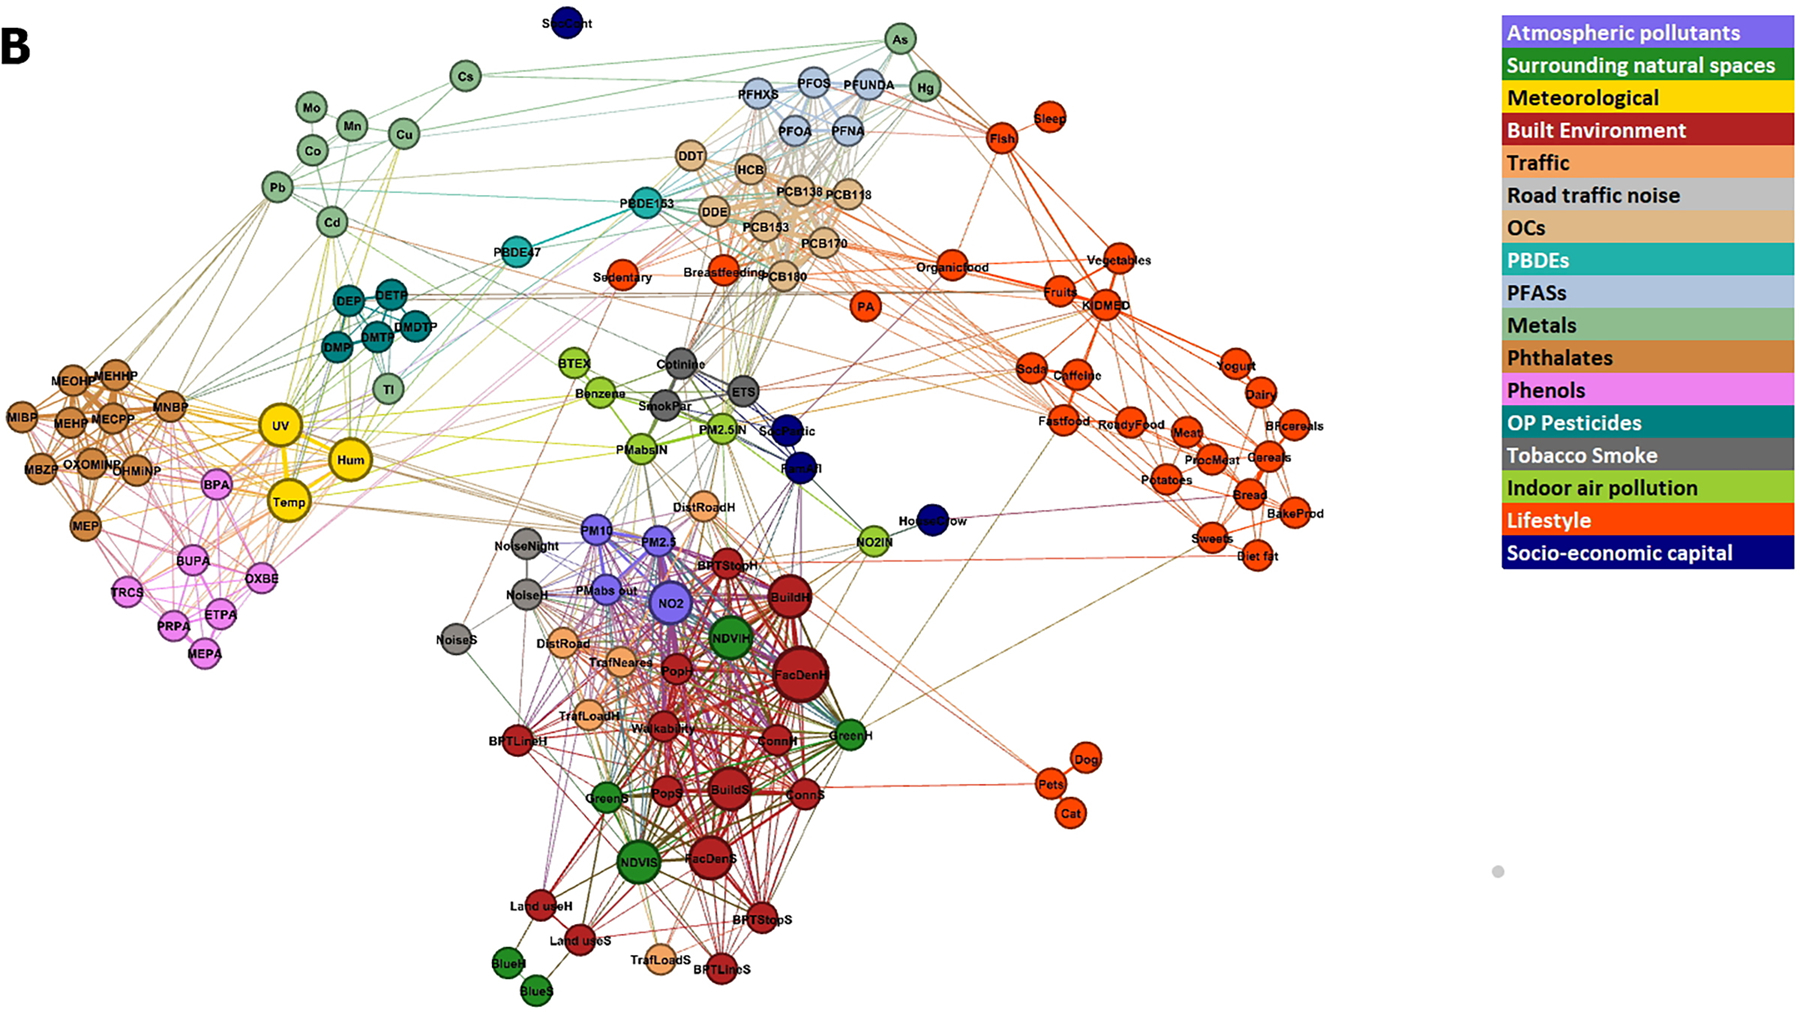
The size of the nodes is proportional to the number of correlations were greater than 0.5 outside the exposure group and the length of the edges is proportional to the inverse of the correlation (the higher the correlation, the shorter the edge length) between exposures. The colour of the nodes represents the pre-defined exposure groups. The minimum absolute correlation to create an edge was 0.10. Figure 3A shows the pregnancy exposome, and Figure 3B shows the childhood exposome. Networks were built using within-cohort correlations.