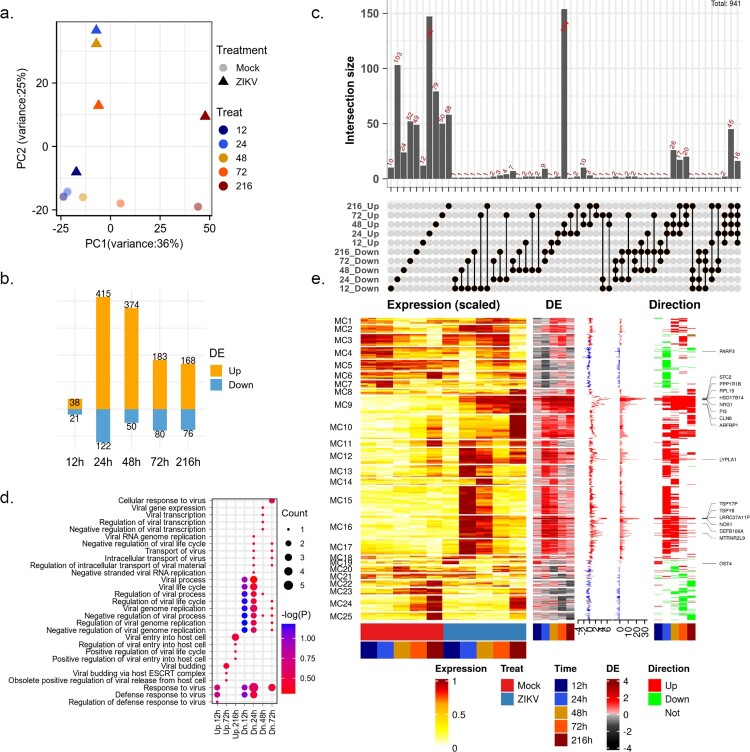
Figure 1.
changes in the global gene expression of HBMECs infected by ZIKV. (a) Principal-component analysis (PCA) of mock- and ZIKV-infected samples in GSE98889. Expression values were log-transformed and scale-normalized. (b) Numbers of genes with significant differential expression (|log 2 (foldchange)| > 1 & P value < 0.05), orange and blue barplot indicate upregulated and downregulated genes, respectively. (c) Venn diagram depicting the overlap of significant DEGs between different time points. (d) Enriched gene ontology (GO) terms associated with “viral” and “virus” at each time point. (e) Time-course expression profiles of 941 differential expression genes across treatment. Columns indicate separate arrays and rows indicate genes grouped by Mfuzz clusters. Then the panel represents time-series differential expression (log 2 (foldchange)), the distribution of differential expression values across the time course (boxplot), the cumulative differential activity (barplot), and the direction of differential expression (heatmap, orange and blue indicate upregulation and downregulation).

