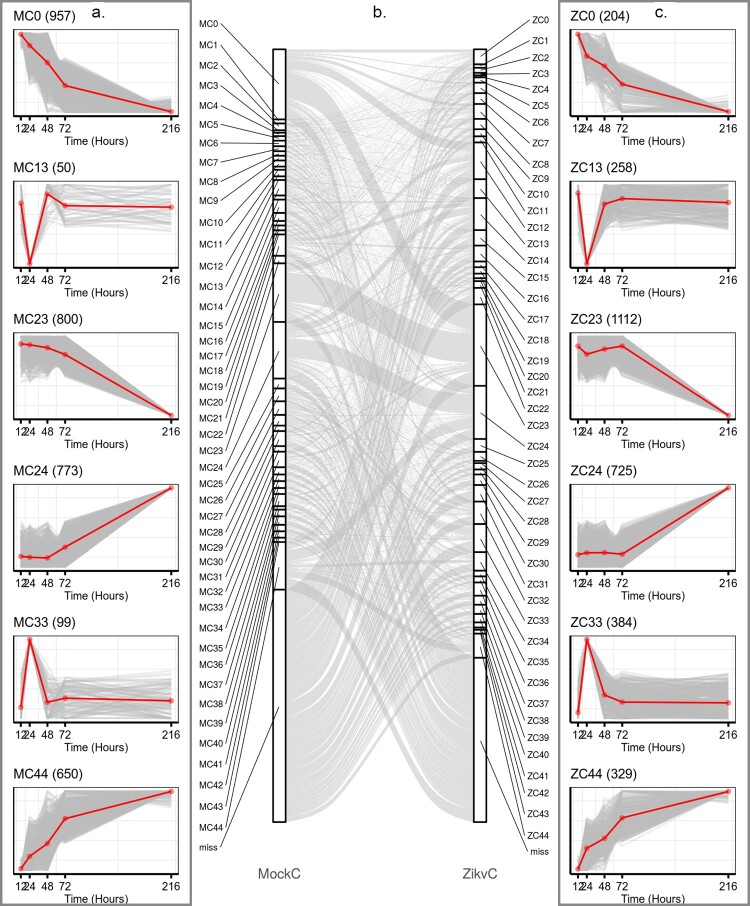
Figure 3.
ZIKV infection reprogrammed host transcriptional structures. Representative gene clusters were identified by STEM clustering under mock- (a) and ZIKV (c) infection conditions, respectively. Red lines indicate the mean expression level of genes in each cluster. The number in the upper right corner of each panel represents the number of genes in each cluster. (b) Sankey diagram showing gene expression patterns of transition between mock (left side)- and ZIKV- infected (right side) conditions.

