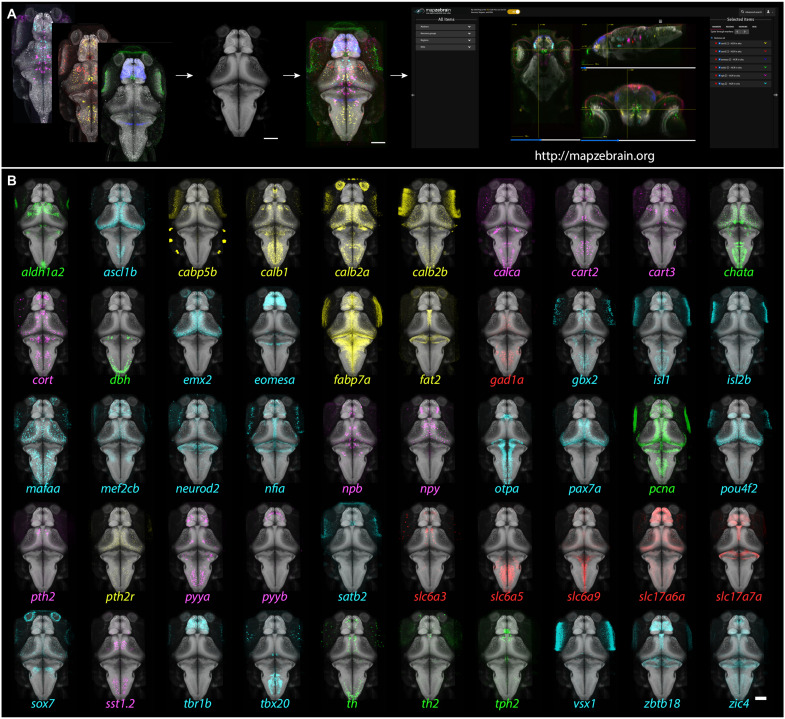
Fig. 1. Gene expression atlas of the larval zebrafish brain: Pipeline and example patterns.
(A) Multiplexed FISH was performed on 6-dpf Tg(elavl3:H2b-GCaMP6s) fish. The GCaMP6s signal was used to align the images to the reference brain, and the aligned images were then uploaded to the mapzebrain atlas. Scale bar, 100 μm. (B) 3D projections of 50 selected FISH images, registered into the standard brain. Color coding: green, enzymes; cyan, transcription factors; red, neurotransmitter synthesizing enzyme (GABAergic) and transmitter transporters (glutamatergic); magenta, neuropeptides; yellow, miscellaneous other. Scale bar, 100 μm.

