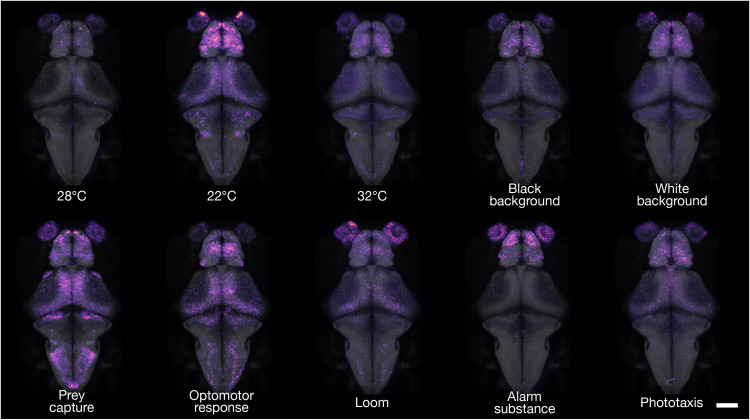
Fig. 3. cfos brain activity maps of freely swimming fish.
3D projections of cfos FISH-labeled areas of neuronal activity during behavior. Dorsal views are shown for each experimental condition. For interactive viewing, spanning the full depth of the brain, see mapzebrain atlas at https://mapzebrain.org/. Scale bar, 100 μm.

