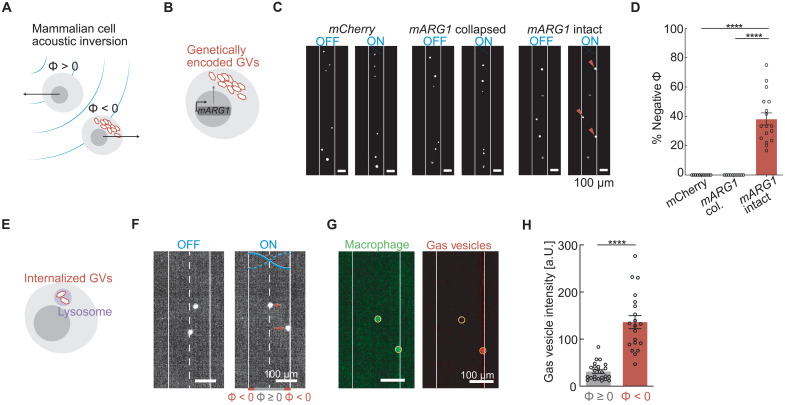
Fig. 5. GVs invert cellular response to ARF in mammalian cells.
(A) Schematic drawing of mammalian cells experiencing an inversion of their acoustic contrast factor due to intracellular GVs. (B) Schematic drawing of genetically modified mammalian cells expressing intracellular GVs as mammalian acoustic reporter genes (mARG1). (C) Fluorescence images of mammalian cells inside the microfluidic channel with either intact mARG1 GVs, collapsed mARG1 GVs, or mCherry, either in the presence or in the absence of applied ultrasound. (D) Percentage of cells that have negative contrast factor with either intact mARG1 GVs (38 ± 4%, n = 17 technical replicates), collapse mARG1 GVs (0%, n = 10 technical replicates), or mCherry (0%, n = 11 technical replicates). Mann-Whitney test (****P < 0.0001). (E) Schematic drawing of GVs internalized in the lysosomal compartment of a mammalian cell. (F) Fluorescence images of macrophages with internalized GVs inside the microfluidic channel either in the presence or in the absence of applied ultrasound. Cells that move to the walls (solid line) have a negative contrast factor, while those that move to the center (dashed line) have a positive acoustic contrast. (G) Images of fluorescence from either macrophages or GVs in the applied acoustic field. Circular regions of interest indicate the location of the macrophage. (H) Fluorescence intensity of GVs at the location of the macrophages that have either negative (n = 20 cells) or non-negative (n = 24 cells) contrast factors. Mann-Whitney test (****P < 0.0001).

