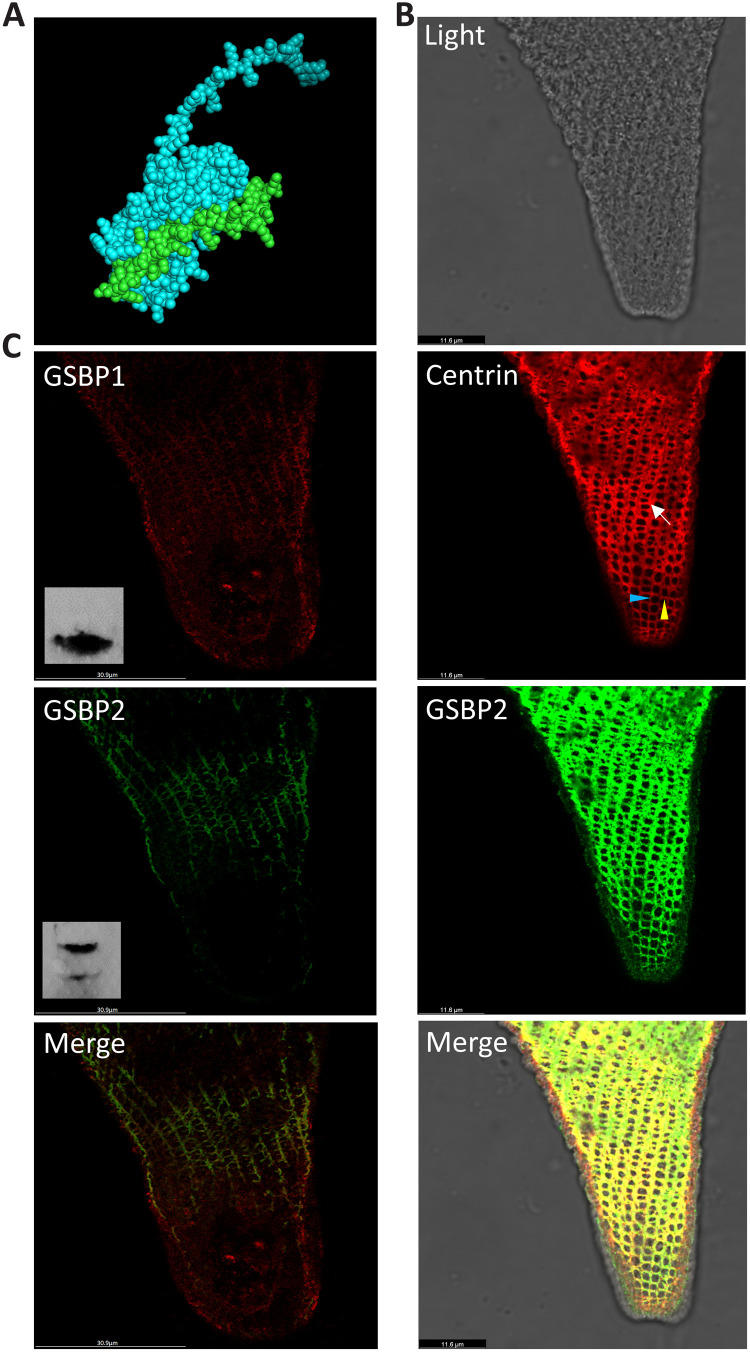
Fig. 5. Colocalization of spasmin and GSBP in S. minus.
(A) AlphaFold2 prediction of partial GSBP sequences (green) and spasmin (cyan). (B) Colocalization of GSBP2 and spasmin. Red: IF using anti-centrin antibody (mouse) represents spasmins that have high abundance in the cell based on MS result. Green: IF using anti-GSBP2 antibody (rabbit). Blue and yellow arrowheads: Contractile fibrillar bundles running in different directions. Note that all layers of IF images are merged and shown. (C) Localization of GSBP1 and GSBP2. Red: IF using anti-GSBP1 antibody (mouse). Inset: Western blot result of GSBP1. Green: IF using anti-GSBP2 antibody (rabbit). Inset: Western blot result of GSBP2; the two bands are GSBP1 and GSBP2, respectively. Note that only one layer of IF images is shown.

