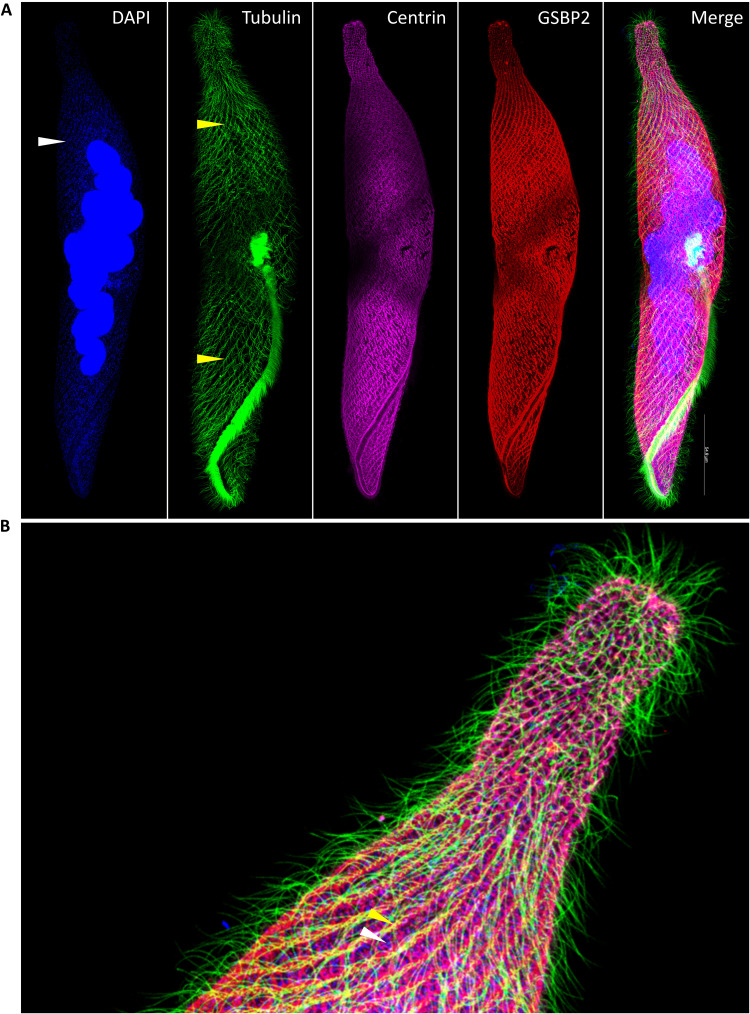
Fig. 7. Distribution patterns of subcellular structures in S. minus.
(A) Super-resolution IF image shows the localization of tubulin, spasmin, and GSBP2. Blue: DAPI staining of DNA. Note that the foci (white arrowhead) indicate the mitochondria. Green: Tubulin-stained using tubulin–Atto 488; yellow arrowheads depict microtubule-based fibrillar bundles. Purple: IF using anti-centrin antibody (mouse). Red: IF using anti-GSBP2 antibody (rabbit). (B) Distribution patterns of the subcellular structures.

