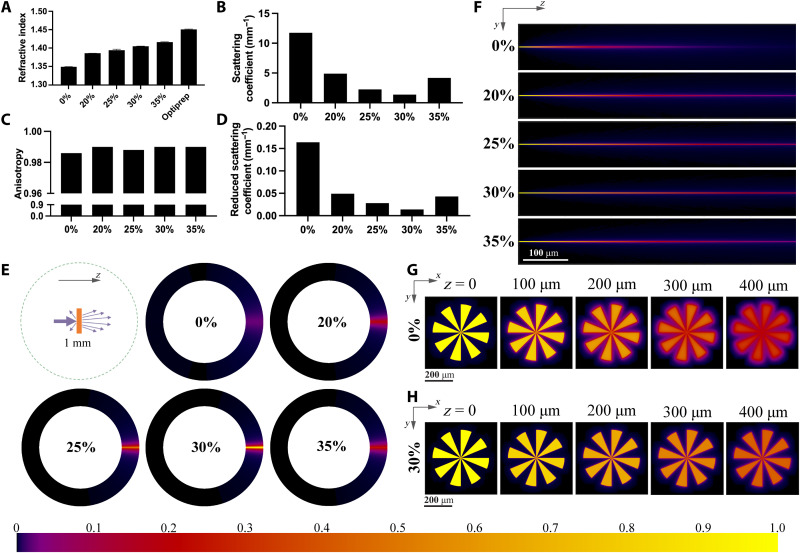
Fig. 2. Optical properties and light energy distribution.
(A) Refractive index of 5% GelMA bioink with various IDX concentrations at 405 nm and the refractive index of Optiprep solution (60% IDX). (B to D) Scattering coefficient, anisotropy, and reduced scattering coefficient of 40 million cells/ml cell–encapsulated bioink with various IDX concentrations. (E) Angular intensity distribution of the light scattered by cell-encapsulated bioink with various IDX concentrations. Light propagates in the z direction. (F) Spatial distribution (in YZ cross section) of light in the cell-encapsulated bioink with various IDX concentrations. (G) Projected pattern (in XY cross section) at different z depths of the cell-encapsulated bioink with 0% IDX. (H) Projected pattern (in XY cross section) at different z depths of the cell-encapsulated bioink with 30% IDX. Color bar denotes the relative light intensity in (E) to (H).

