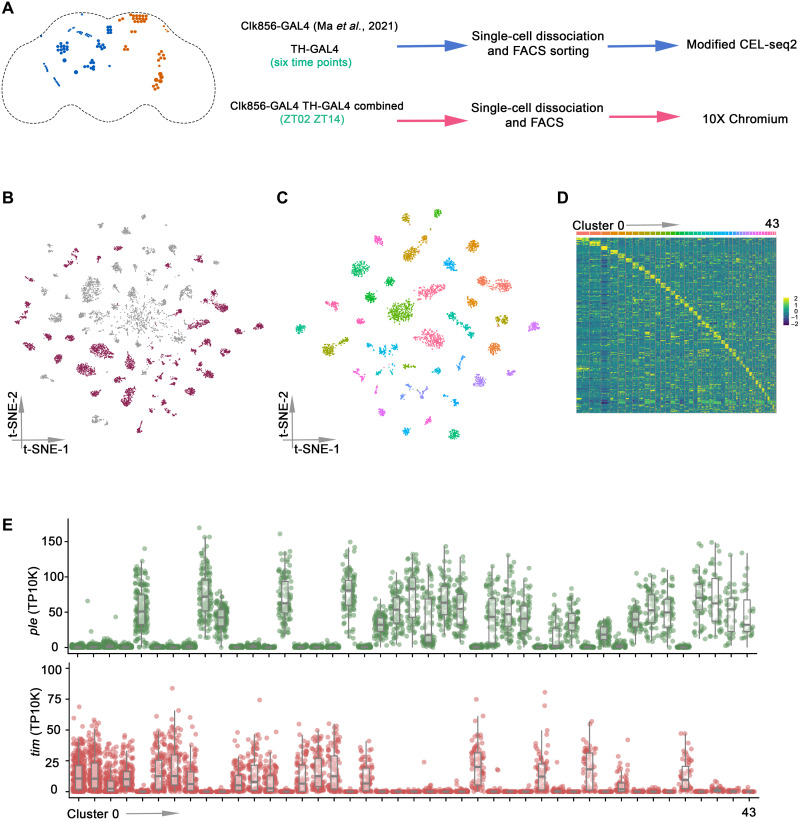
Fig. 1. Single-cell RNA sequencing of Drosophila clock neurons and DANs by plate and droplet-based methods.
(A) Schematic workflow of single-cell RNA sequencing data generation. The clock neurons (orange) and DANs (blue) are shown in the schematic depiction on the left panel. Enhanced green fluorescent protein (EGFP)–labeled DANs were sorted into 384-well plates by fluorescence-activated cell sorting (FACS), and single-cell RNA sequencing libraries were prepared by modified CEL-seq2 method. For droplet-based method, TH-GAL4 and Clk856-GAL4 were combined into a stable line to assay DANs and clock neurons simultaneously. Fly brains were dissected and dissociated before droplet encapsulation of individual cells with barcoded beads in 10X Chromium. (B) t-distributed stochastic neighbor embedding (t-SNE) plot showing the 9025 cells grouped into 70 clusters. High-confidence clusters (see Materials and Methods) are shown in purple. (C) t-SNE plot of 4543 Drosophila clock and DANs in 43 high-confidence clock and DAN clusters from LD conditions. The clusters are colored by their cell types. (D) Heatmap showing the expression levels of the top 5 differentially expressed genes (rows) in cells (columns). Clusters are ordered by size and are represented by different colors on top of the heatmap. (E) Dot plot showing tim (bottom) and ple (top) expression in all clusters. Gene expression levels for each cell were normalized by total expression level and reported by transcripts per 10 thousand transcripts (TP10K). Clusters are ordered by size.

