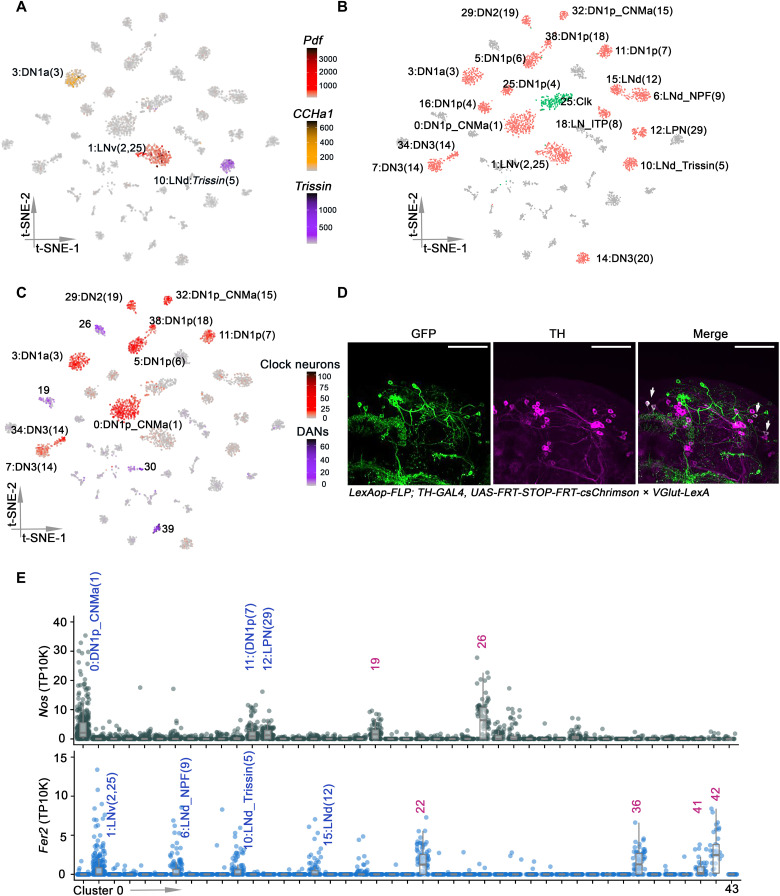
Fig. 2. Identifying clock neurons and DANs clusters.
(A) t-SNE plots showing Pdf (red), Trissin (purple), and CCHa1 (yellow) expression in all clusters. Each cell is colored by the expression (color bars, TP10K) with gray indicating low expression and black indicating the highest expression. (B) t-SNE visualization of the annotated clock clusters. Each clock neuron cluster retains its original identifying number in the parentheses, as it was previously reported. The clusters in red were all previously identified, and cluster 2 (green) was previously unknown. (C) t-SNE plots showing VGlut expression in all clusters. Each cell is colored by the expression of VGlut (color bars, red and purple represents VGlut expression in clock neurons and DANs, respectively, TP10K), with gray indicating low expression and black indicating the highest expression. (D) Confocal stack of images showing antibody staining for GFP (left), TH (middle), and the merged image (right) in VGlut-LexA > LexAop-FLP; TH-GAL4 > UAS-FRT-STOP-FRT-CsChrimson.venus fly brains. Two PPM1 and two PPL1 neurons are both GFP-positive and TH-positive. Scale bars, 50 μm. (E) Dot plot showing Fer2 (bottom) and Nos (top) expression in all clusters. Gene expression levels for each cell were normalized by total expression level and reported by TP10K. Clusters are ordered by size.

