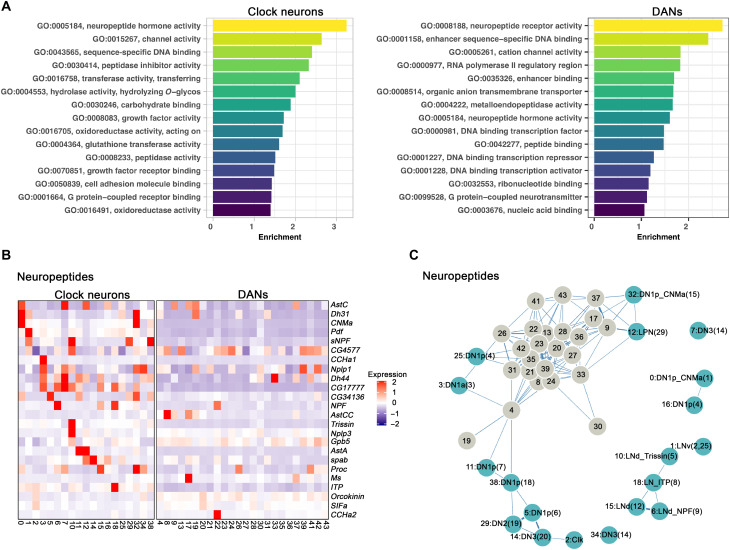
Fig. 3. Neuropeptide expression in clock neurons and DANs clusters.
(A) GO analysis of enriched marker genes found in the clock neuron and DAN clusters. The enriched GO terms were ranked by their relative enrichment. (B) Heatmap showing the expression levels of neuropeptides in clock neurons (left) and DANs (right). Red indicates high expression, and purple indicates low expression. (C) Gene expression correlation of neuropeptides in clock neurons and DANs. We calculated the Spearman’s correlation coefficients between expression patterns of neuropeptides across different clock neuron and DANs cell types, and the result is visualized in a force-embedded layout. Each cluster is represented by a node with the width of the edge representing the strength of the gene expression.

