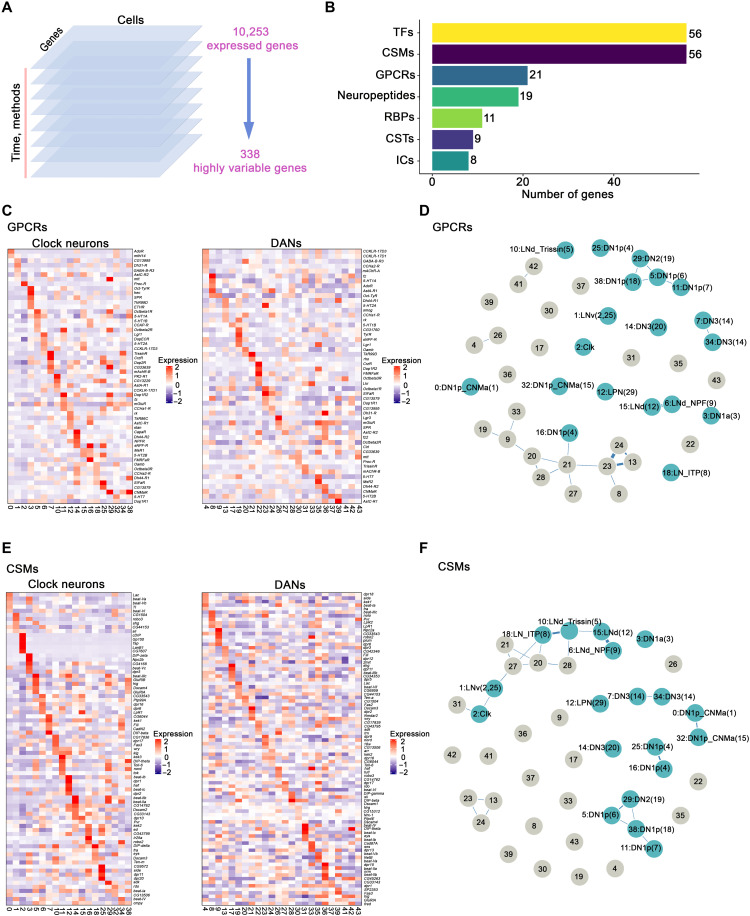
Fig. 4. GPCRs and CSMs expression in clock neurons and DANs.
(A) Schematic workflow of data integration and clustering analysis. We first separated the single-cell gene expression results by time points and methods. In each dataset, 3000 highly variable genes were calculated and only the conserved variable genes (338 genes) were used for final single-cell clustering. (B) Bar plot showing the number of highly variable genes from different gene groups including TFs, CSMs, GPCRs, neuropeptides, RNA binding proteins (RBPs), chemical synaptic transmission–related genes (CSTs) and ion channels (ICs). (C and E) Heatmaps showing the expression levels of GPCRs (C) and CSMs (E) in clock neurons and DANs. (D and F) Gene expression correlation of GPCRs (D) and CSMs (F) in clock neurons and DANs. We calculated the Spearman’s correlation coefficients between expression patterns of GPCRs (D) and CSMs (F) across different clock neuron and DANs cell types; the result is visualized in a force-embedded layout. Blue nodes represent clock neuron clusters, and gray nodes represent DAN clusters. Each cluster is represented by a node with the width of the edge representing the strength of the gene expression.

