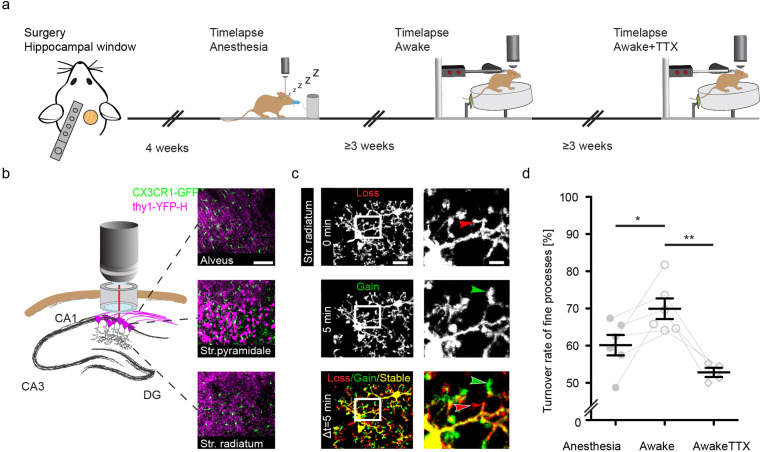
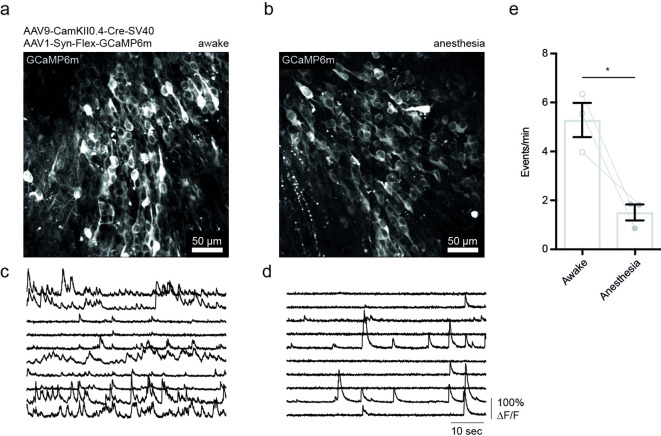
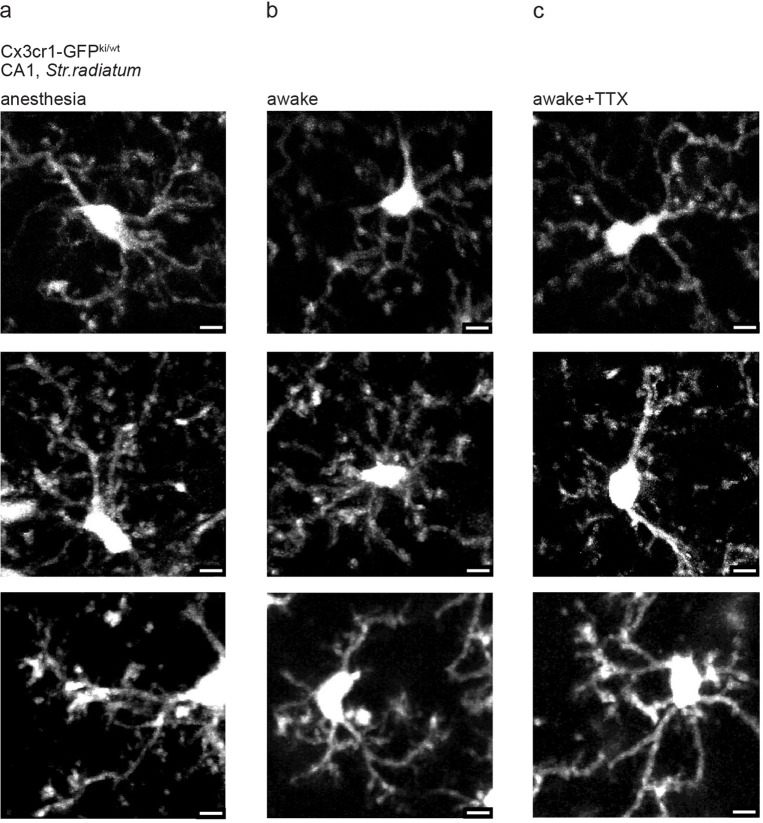
Figure 1. Increased microglial motility in the hippocampus of awake mice.
Experimental paradigm of repetitive microglia imaging in dorsal CA1 (stratum radiatum [SR]) in the same mice under varying conditions. (b) Schematic of the accessible hippocampal layers in CA1 through a chronic hippocampal cranial window. CX3CR1-GFP::thy-1-YFP-H transgenic mice allowed for simultaneous visualization of microglia (green) and neurons (magenta). (c) Representative image of a microglia cell and its processes in an awake mouse imaged in CA1, SR. Subsequent time points (0, 5 min) were superimposed (Δt=5 min) to measure gained (green arrow), lost (red arrow), and stable (yellow area) processes. (d) Turnover rate of microglia fine processes (i.e. motility) at varying conditions (n=6 mice ‘anesthesia’, ‘awake’; n=4 ‘awake+tetrodotoxin [TTX]’); one-way ANOVA with Bonferroni’s multiple comparison test, F(2,13) = 10.22; p=0.0291 (anesthesia vs. awake), p=0.0014 (awake vs. awake+TTX). Error bars: SEM. Scale bars: (b) 100 μm, (c) 10 μm, 2 μm; *p<0.05, **p<0.01.


