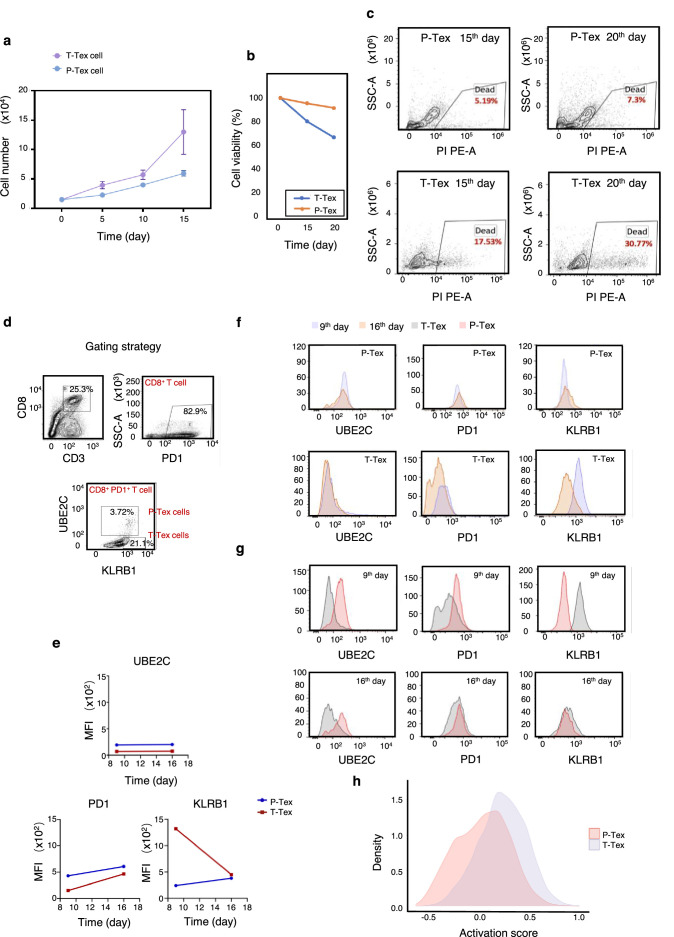
Figure 4. The survivaland proliferation capacity of P-Texs in vitro.
Comparing the proliferation (a) and survival (b–c) capacity of P-Tex and T-Tex cells cultured with IL-2 for 15 and 20days in vitro measured by CCK8 experiment; proliferation experiment, shown by the mean ± SEM. (d–g) Representative flow cytometry assay of UBE2C, PD1, and KLRB1 of P-Tex cells after 9 and 15 days of stimulation with anti-CD3/CD28 microbeads in vitro. (d) The gating strategies of PD1, KLRB1, and UBE2C. (e–g) Mean fluorescence intensity (e) and cell count (f–g) of UBE2C, PD1, and KLRB1 in P-Tex and T-Tex cells at different days detected by flow cytometry. (h) Histogram of activation states of P-Tex and Tex cells by single-cell RNA-seq data.

