. 2023 Feb 22;12:e82705. doi: 10.7554/eLife.82705

Figure 5. The expression of CDK4 gene in P-Tex2 cluster is associated with the treatment outcomes of HPV+ head and neck squamous cell carcinoma (HNSCC) patients.

(a) Single-cell transcriptomic profiling of HNSCC tumor microenvironment (TME). Twenty cell clusters are identified, colored by cell types. (b) The proliferation status of P-Tex and epithelial cells in violin plot. (c) The kernel density estimate distribution of proliferation markers (CDK4 and MKI67) and epithelial cancer cell markers (KRT15 and CD24) in uniform manifold approximation and projection (UMAP) plots. (d) The overall survival rate of HPV+/HPV- HNSCC patients in The Cancer Genome Atlas (TCGA) cohort related to the expression levels of CDK4 gene, adjusted for age and gender. (e) The proportion of P-Texs, T-Tex, and TEFF clusters in HPV+ and HPV- samples in TCGA cohort by using the deconvolution algorithm; statistics were assessed by Chi-square tests. Marker genes that were used to define cell clusters in (a) are deconvolved into the TCGA data to obtain the proportion of P-Texs, T-Tex, and Teff clusters in the TCGA cohort. (f) The cell viability of P-Tex and cancer epithelial cells assessed by CCK8 experiment after Abemaciclib treated in vitro. ***: p<0.001, **: p<0.01, *: p<0.05.

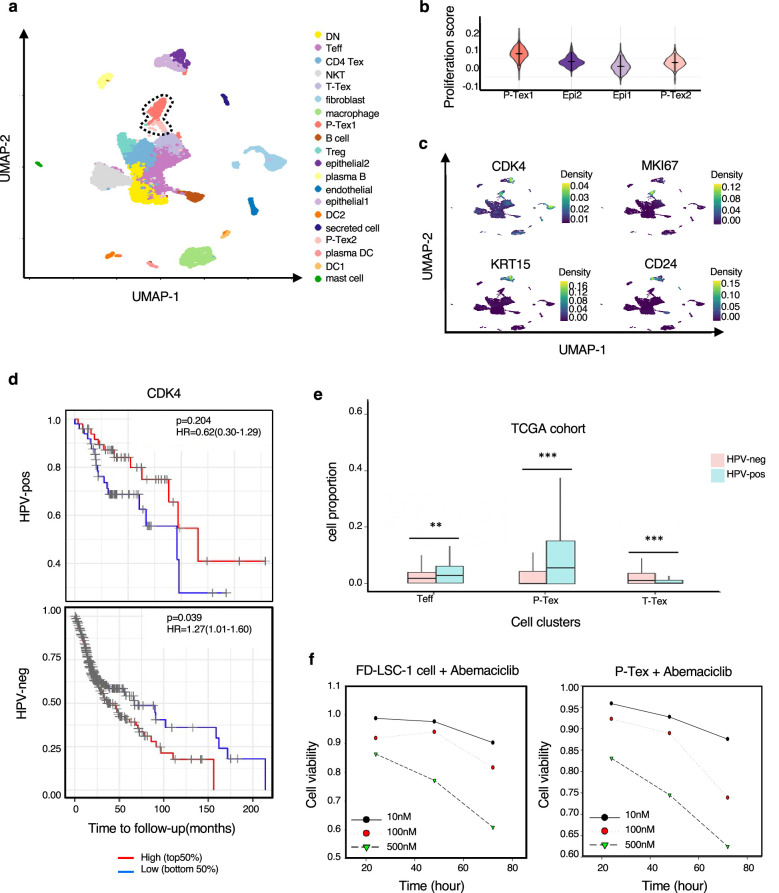
Figure 5.

Figure 5—figure supplement 1. The extended summary of functional properties of cell clusters in Figure 5.

Figure 5—figure supplement 1.

(a) Average expression of selected T cell function-associated genes across different cell clusters. (b) Gene ontology (GO) analysis of differentially expressed genes in two P-Tex and cancer epithelial cell clusters. (c) The gene set enrichment analysis (GSEA) diagrams show the enrichment of cell cycle genes in P-Tex clusters and cancer epithelia cluster. (d) The proliferation status of each T cell cluster; statistics were assessed by Dunn's tests. ***: p<0.001, **: p<0.01, *: p<0.05.
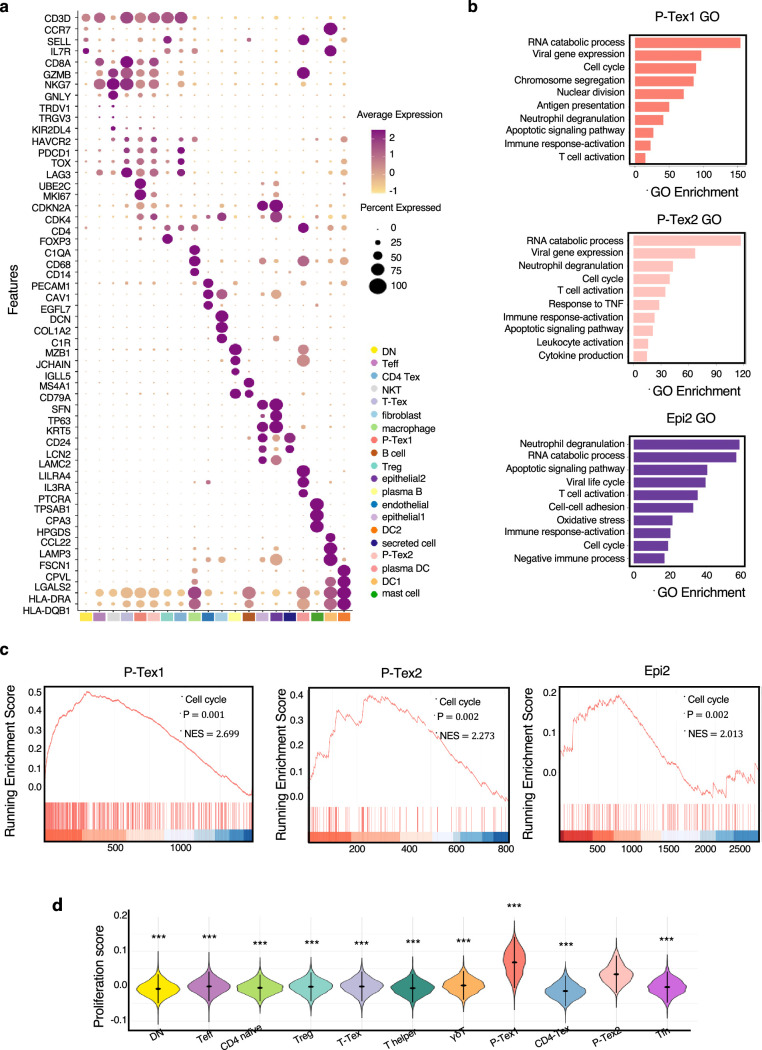
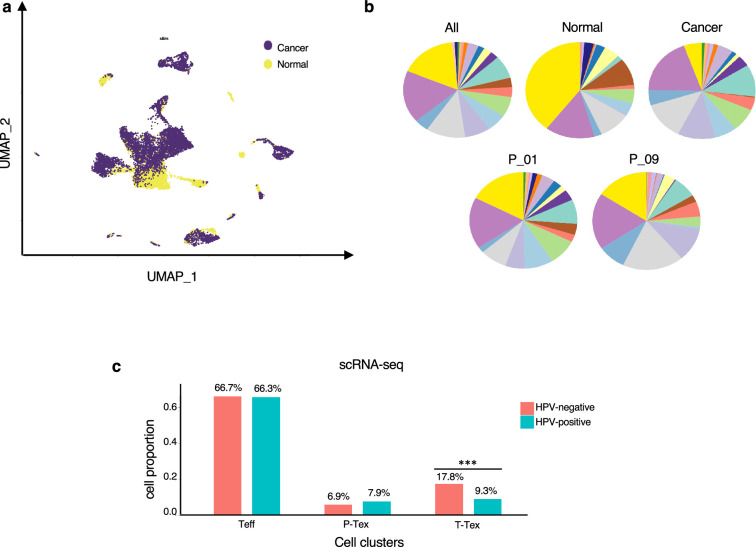
Figure 5—figure supplement 2. The extended summary of function properties of cell clusters in Figure 5.

Figure 5—figure supplement 2.

(a) The distribution of cells in cancer and normal tissues in uniform manifold approximation and projection (UMAP) plots. (b) The proportion of each cell cluster in all samples, cancer vs. normal tissue samples, and individual samples, colored by cell types. (c) Comparing the proportion of P-Texs, T-Tex, and Teff clusters in HPV+ and HPV- samples in single-cell sequencing data; statistics were assessed by Chi-square tests. ***: p<0.001, **: p<0.01, *: p<0.05.