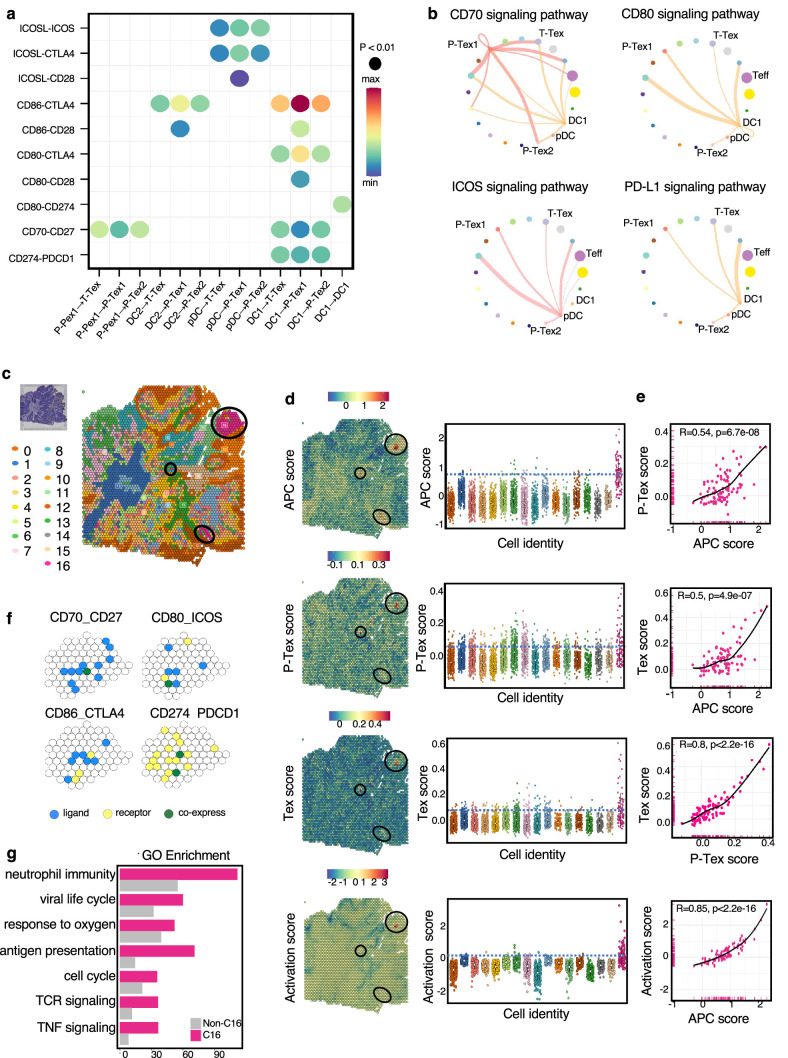
Figure 6. The cell–cell interactions between T cells and APC cells are enriched in the proliferation and cell activation pathways in head and neck squamous cell carcinoma (HNSCC) tumor microenvironment (TME).
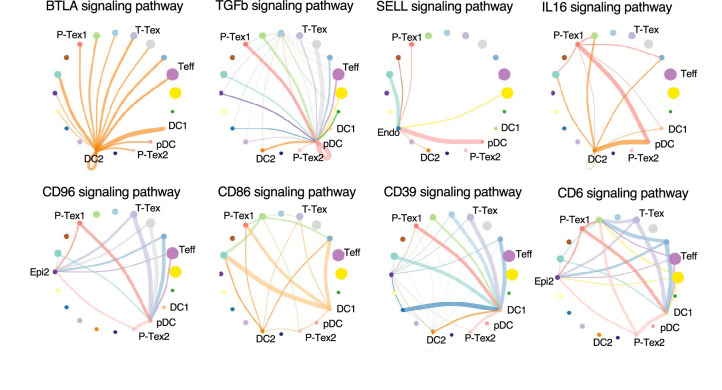
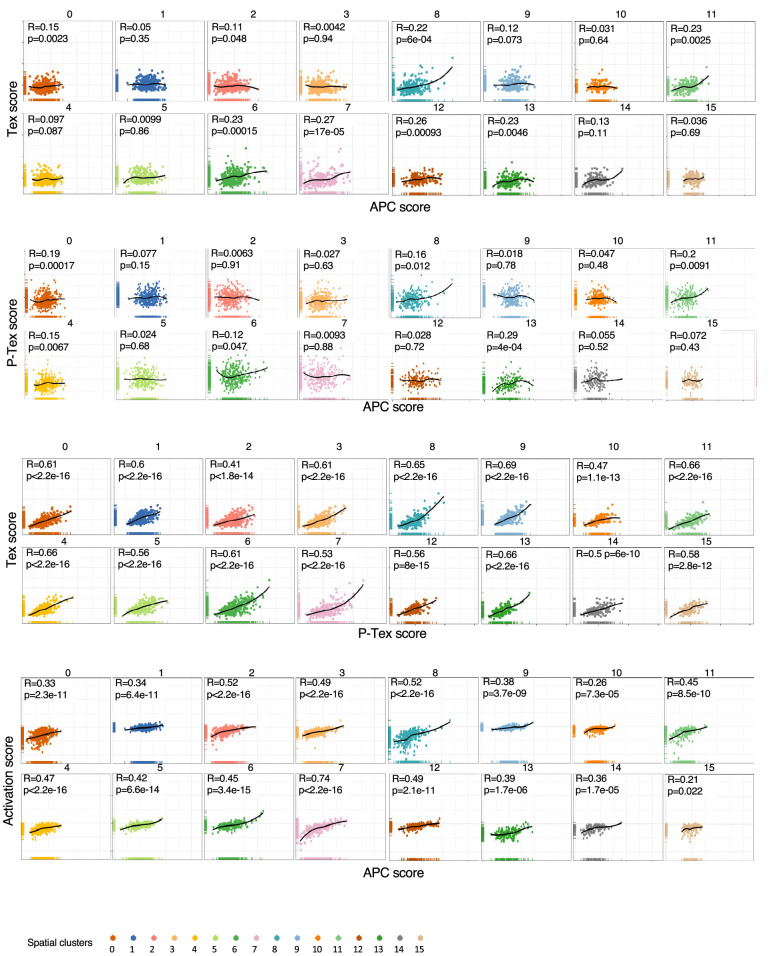
(a) The communication probabilities mediated by selected ligand–receptor pairs among different cell types. The color gradient shows the level of interaction. (b) Network circle graphs visualize the inferred communication network of signaling pathways among different cell clusters derived by ligand–receptor interactions. The color of lines are consistent with the ligands. The width of lines are proportional to the interaction strength, and the circle sizes are proportional to the number of cells in each clusters. (c) The spatial transcriptomic landscape of representative HNSCC samples. (d–e) P-Tex and Tex features were co-expressed in APC area (cluster 16). The circles in SpatialDimPlot (d, left) represent APC, P-Tex, and Tex scores enriched in the APC area (cluster 16). The Texs and P-Tex scores were higher in the APC aggregation area (d, right). The correlation of P-Tex, Tex, activation scores, and APC scores in the spatial transcriptome (e). (f) Spatial feature plots of selected ligands–receptor interactions enriched in APC area. Spatial feature plots showing the expression pattern of single ligand genes (CD70, CD80, CD86, CD274, yellow spots), single receptor genes (CD27, ICOS, CTLA4, PDCD1, blue spots), and co-expression pattern (green spots) in APC area. (g) Gene ontology (GO) analysis identified the enriched gene functions in APC area of spatial transcriptome.


