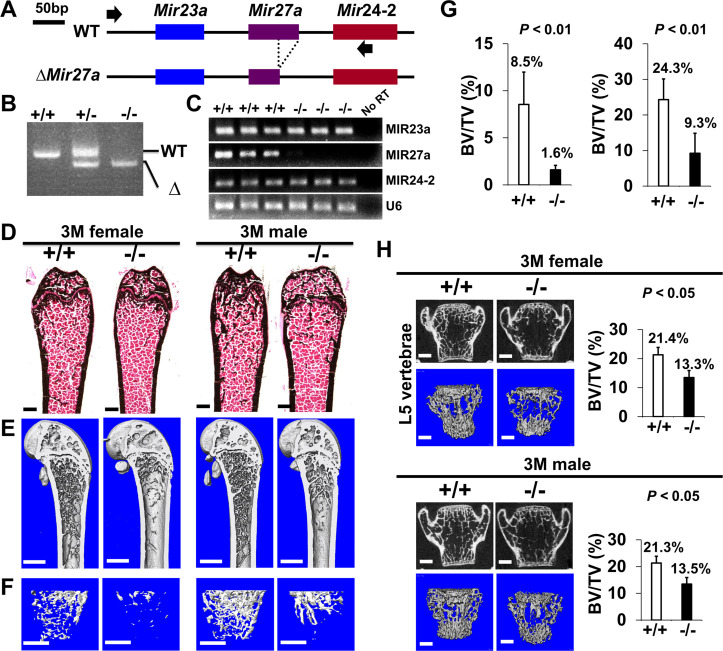
Figure 4. The loss of MIR27a alone causes osteoporotic defects.
(A) Diagrams illustrate the Mir23a cluster (WT), and the creation of mouse strains deficient for Mir27a (∆Mir27a) by CRISPR/Cas9 genome editing. Broken lines and arrows indicate the deleted genomic regions and primers used for PCR genotyping analysis, respectively. (B) PCR-based genotyping identifies the wild-type (+/+), heterozygous (+/–), and homozygous (–/–) for miR-27a mice showing the mutant (∆) alleles with deletion of Mir27a result in the generation of shorter PCR products. (C) RT-PCR analysis reveals the disruption of MIR27a but not MIR23a and MIR24-2 RNAs in ∆Mir27a mutants. The analysis of small non-coding RNA U6 is used as an internal control. Femurs of the 3-month-old (3 M) wild-type (+/+) and mutant (–/–) males and females were analyzed by μCT scanning (E–F), followed by sectioning and von Kossa staining (D). The three dimensional (3D) rendered μCT images of the distal femur (E) and femoral metaphysis (F) were subject to quantitative analysis for trabecular bone volume (G). (H) Spines of the 3-month-old (3 M) ∆Mir27a males and females were analyzed by μCT scanning. Images show the μCT scanned wild-type (+/+) and mutant (–/–) L5 vertebrae (top) and 3D-rendered trabecular bone (bottom). Quantitative analyses of trabecular bone volume per total volume in the femurs (BV/TV, n=5 for female and n=4 for male, mean ± SD; student t-test) and vertebrates (BV/TV, n=3, mean ± SD; student t-test) are shown in graphs. Images (D–F and H) are representatives of three independent experiments. Scale bars, 500 µm (D–F and H).


