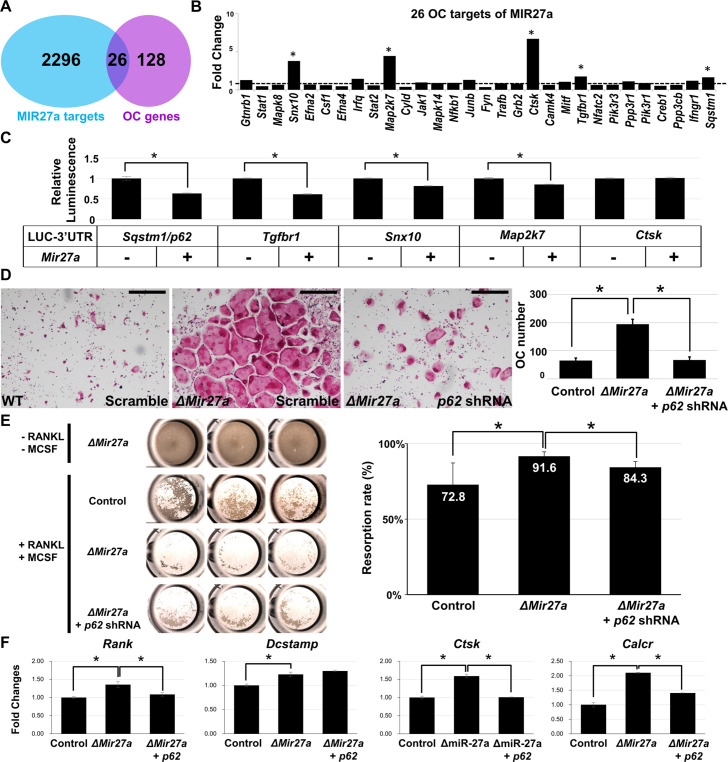
Figure 6. MIR27a-dependent regulation of osteoclast (OC) differentiation is mediated through p62 modulation.
(A) Venn diagrams illustrate our strategy to identify the OC differentiation-associated genes (KEGG: mmu04380) that are directly regulated by MIR27a. (B) The 26 potential targets are examined by quantitative RT-PCR (qRT-PCR) analysis to detect the change of transcript levels in wild-type and ∆Mir27a OC cells (n=3; *, p-value<0.05, two-sided student’s t-test). (C) The 3’UTR-reporter assay examines five potential genes that are direct targets of MIR27a (n=3; *, p-value <0.01, means ± SD, two-sided student’s t-test). (D) A functional study of Sqstm1 also known as p62 reveals the enhancement of OC differentiation caused by the loss of miR-27a is alleviated by lentiviral-shRNA-mediated knockdown. Tartrate-resistant acid phosphatase (TRAP) staining examines the number of mature OC cells in the control, ∆Mir27a, and ∆Mir27a plus shRNA-mediated knockdown of p62 (∆Mir27a+p62 shRNA) cultures (n=3; *, p-value<0.05, means ± SD, two-sided student’s t-test). (E) Pit assay examined OC cells-mediated bone resorption rate of control, ∆Mir27a, ∆Mir27a plus shRNA-mediated p62 knockdown 5 days after differentiation (n=3; *, p-value<0.05, mean ± SD, two-sided student t-test). OC progenitors isolated from ∆Mir27a mice were cultured without RANKL and MCSF as negative control (Top raw). (F) qRT-PCR examined the expression of OC markers after 3 days (Rank and Dcstamp) or 7 days (Ctsk and Calcr) culture of the control, ∆Mir27a, and ∆Mir27a plus shRNA-mediated knockdown of p62 OC cells (n=3; *, p-value<0.05, mean ± SD, student t-test). Scale bars, 500 µm.


