
Figure 3. Preterm labor induced by E. coli involves conserved cell types that display distinct processes in reproductive tissues.
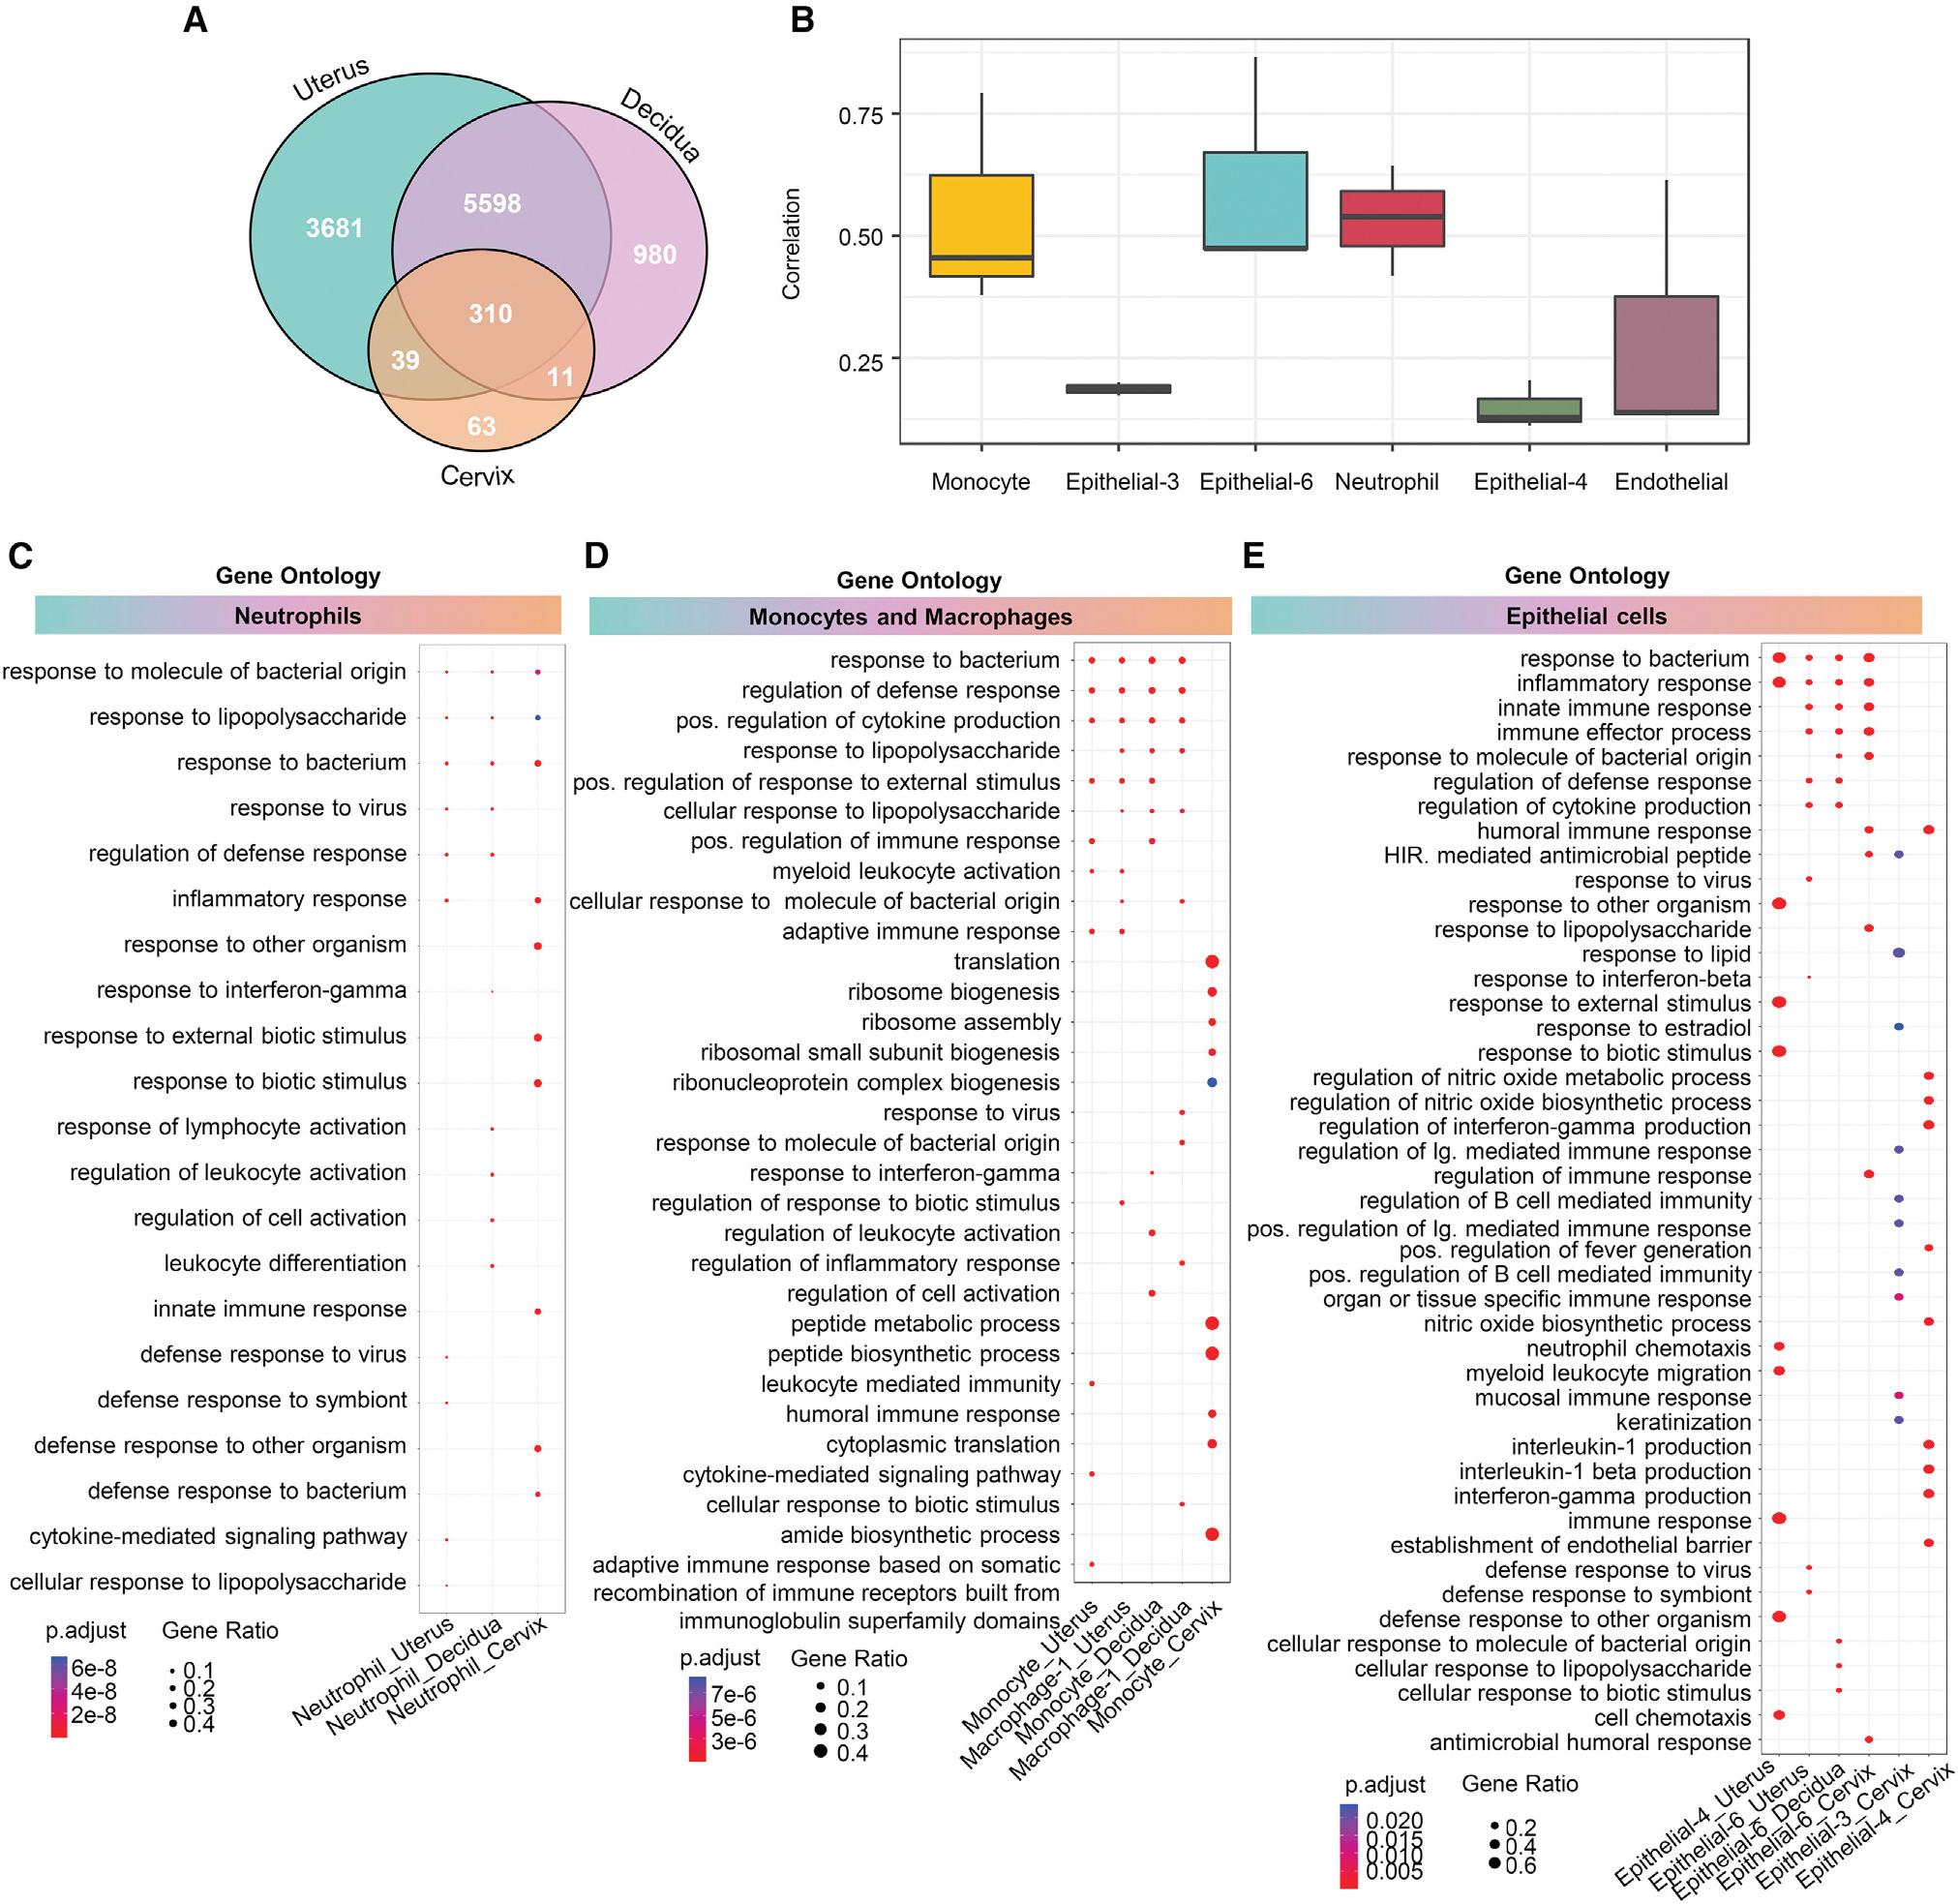
(A) Venn diagrams showing the numbers of differentially expressed genes (DEGs; q < 0.1) that are exclusive to or shared among the uterus, decidua, and cervix.
(B) Boxplots showing the correlation of specific cell types affected by preterm labor and conserved across the uterus, decidua, and cervix, using the Spearman’s method.
(C–E) Cluster profiler dot plots showing the preterm labor-associated Gene Ontology (GO) biological processes that are exclusive to or shared among
(C) neutrophil, (D) monocyte and macrophage, and (E) epithelial cell types from the uterus, decidua, and cervix. The size and color of each dot represent gene ratio and significance level, respectively. 1-sided Fisher’s exact tests were used.
See also Figures S3 and S4 and Table S2.