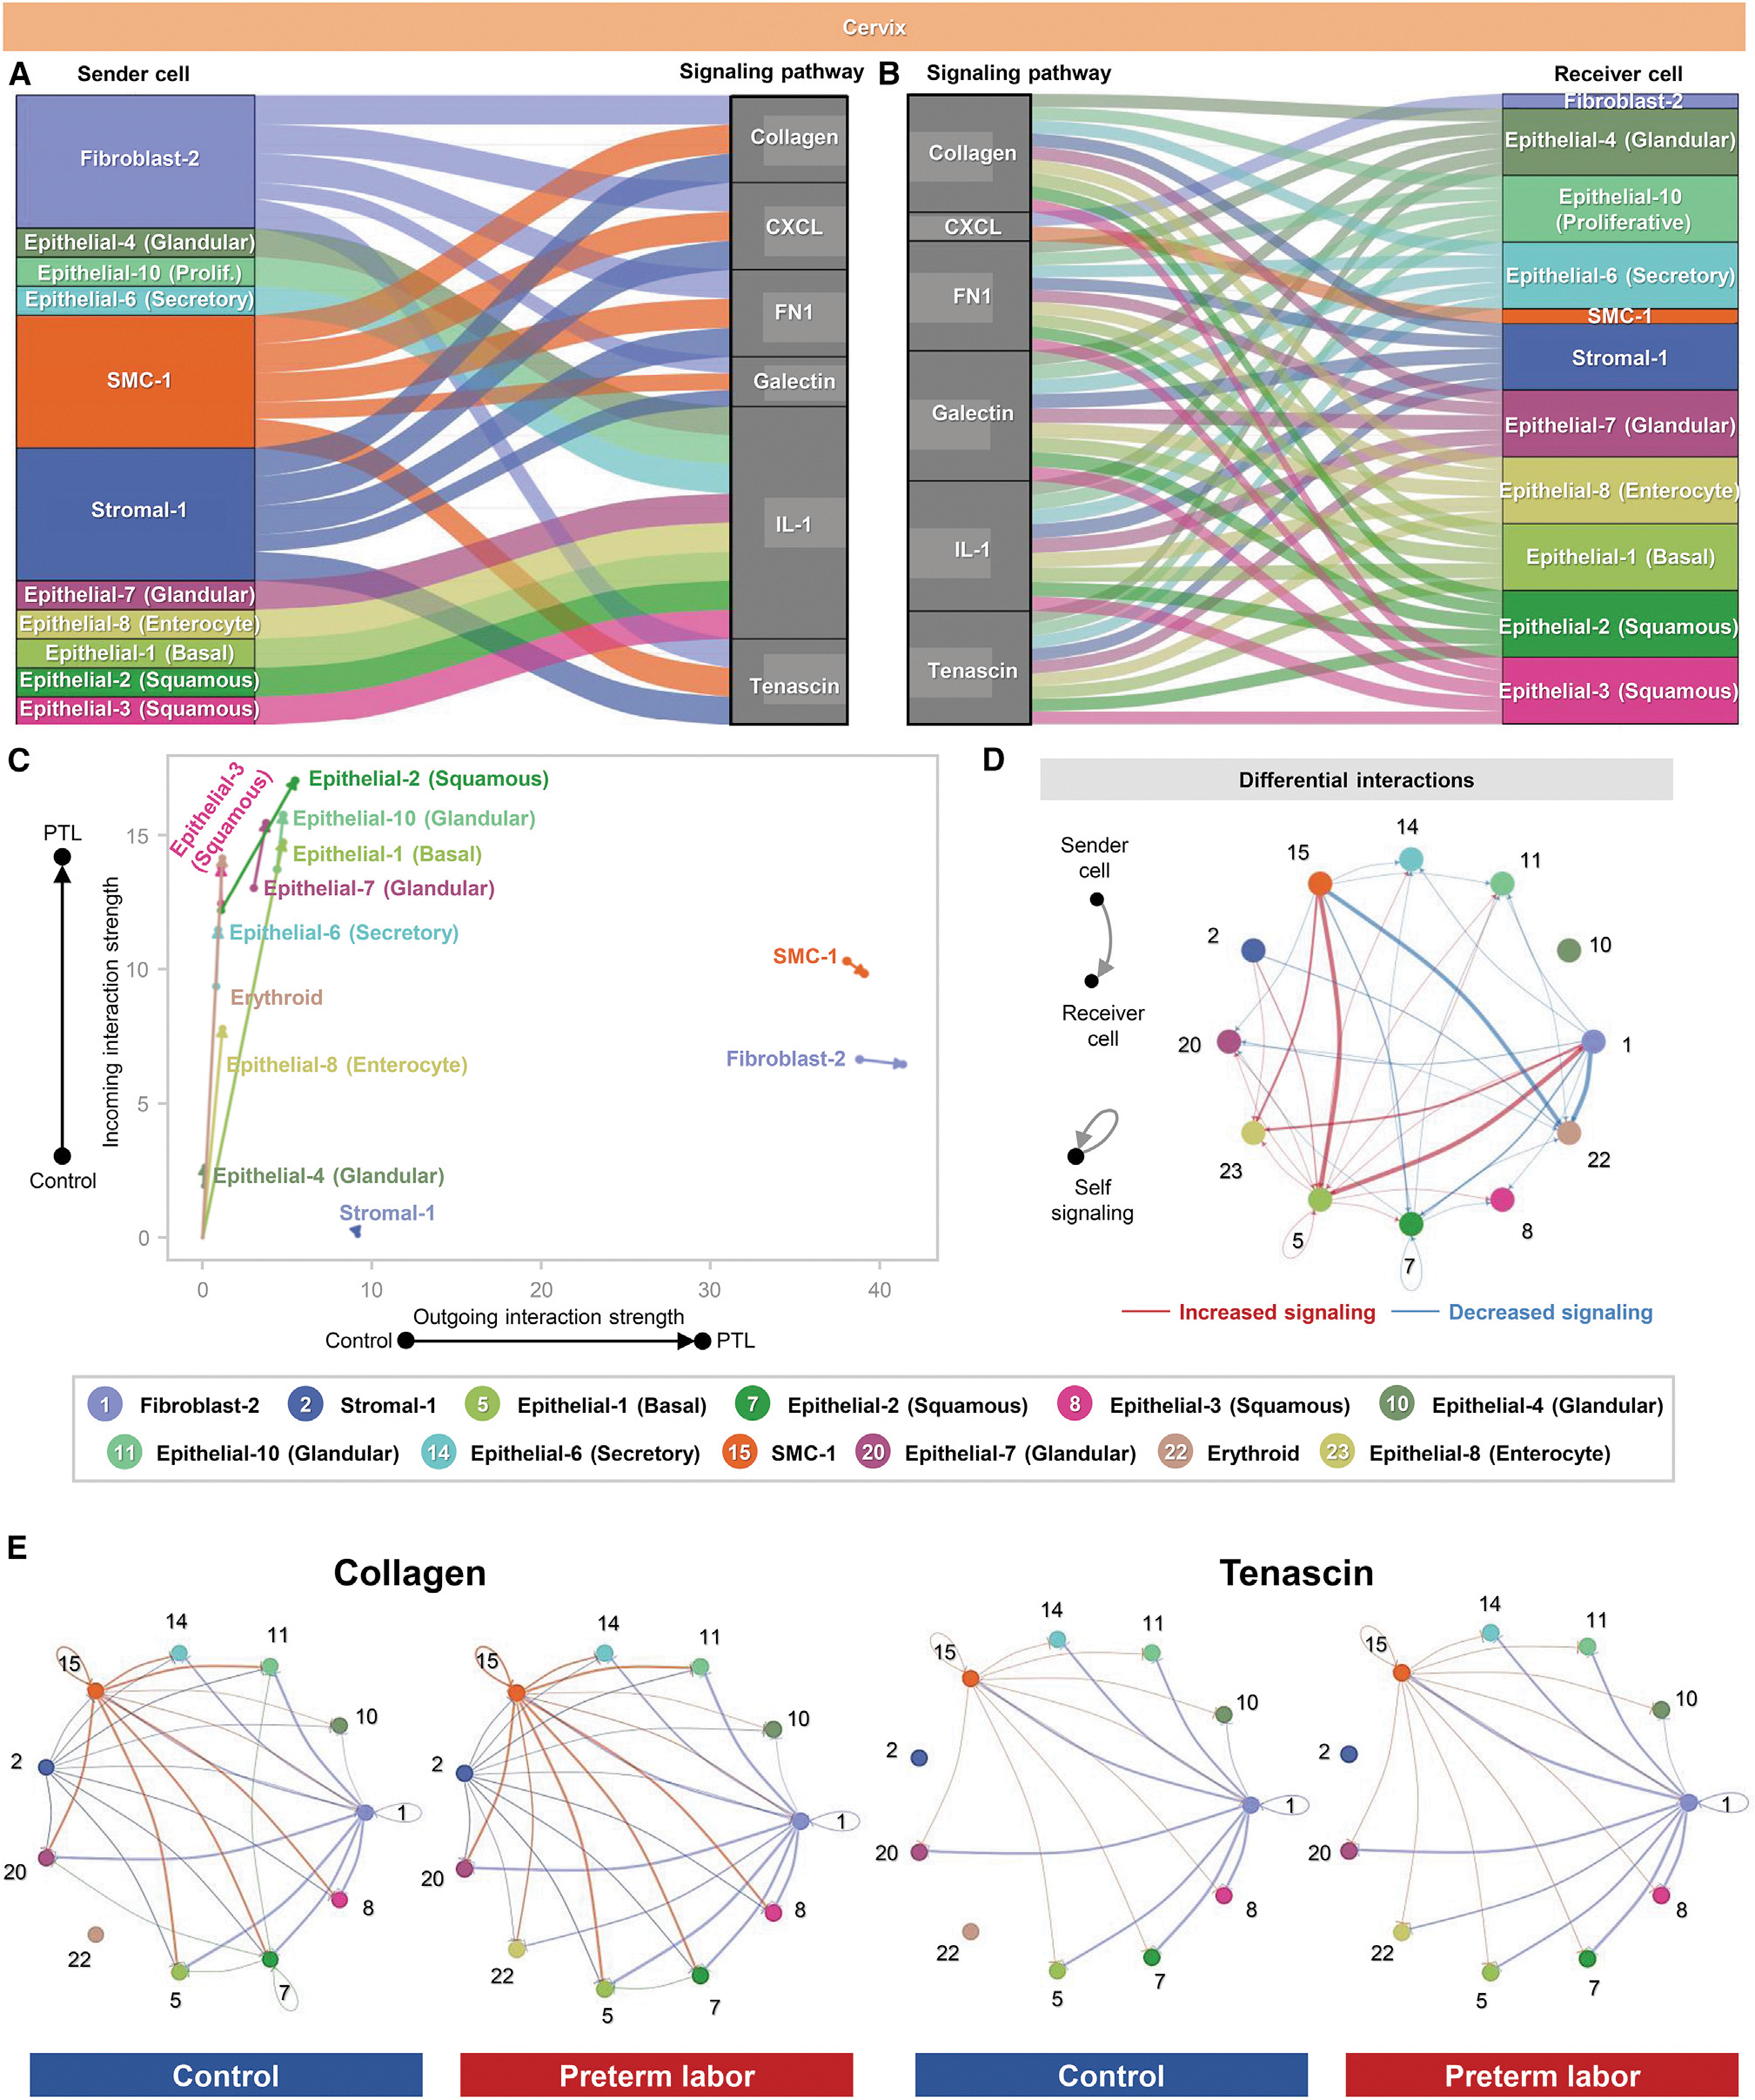
Figure 6. Cellular interactions in the cervix during preterm labor.

(A and B) Alluvial plots showing the roles of specific cell types as senders or receivers of preterm labor-associated signaling in the cervix based on selected enriched signaling pathways (full list of pathways in Figure S7B). Connecting lines are color coded and represent the participation of each cell type as a sender or as a receiver of the indicating signaling pathway. Line thickness is proportional to the strength of interaction.
(C) Arrow plot showing changes in the strength of outgoing and incoming interactions between preterm labor (point of the arrow) and control conditions (base of the arrow) for specific cell types in the cervix.
(D) Circle plots showing the top 25% increased (red) or decreased (blue) signaling interactions in the cervix for specific pathways in preterm labor compared to controls.
(E) Circle plots showing the top 25% of aggregated interactions among cell types in the cervix for control and preterm labor groups. Each node represents a cell type, and the interaction is shown by color-coded lines.
PTL, preterm labor. See also Figures S6 and S8 and Table S3.
