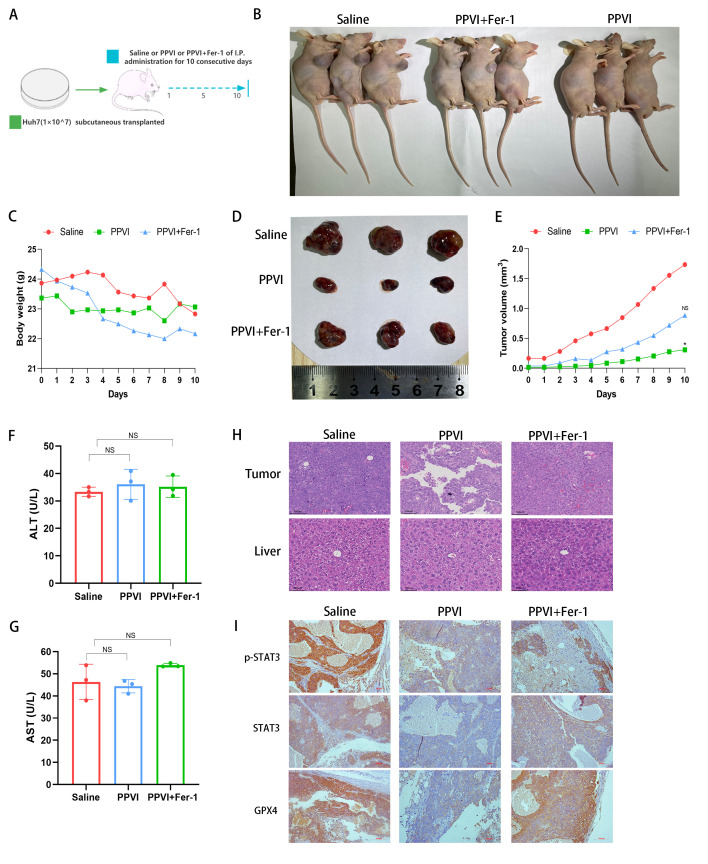
Figure 8.
PPVI suppresses tumor growth in vivo through the STAT3/GPX4 axis. (A) Schematic diagram of the in vivo experiment. (B) Image of mice with subcutaneous tumor xenografts. (C) Muse weight. (D) Images of subcutaneous xenograft mouse tumors. (E) Changes in tumor volume in mice during drug injection. (F and G) The levels of ALT and AST, which are markers of liver function, were measured. (H) Hematoxylin and eosin staining illustrating the morphology of mouse liver and tumor tissue. (I) The level of p-STAT3, STAT3 and GPX4 proteins in the indicated tumor tissue was using immunohistochemistry. *P<0.05 vs. saline group. NS, not significant; PPVI, polyphyllin VI; STAT3, signal transducer and activator of transcription 3; GPX4, glutathione peroxidase 4; Fer-1, ferrostatin-1; AST, aspartate aminotransferase; ALT, alanine transaminase.

