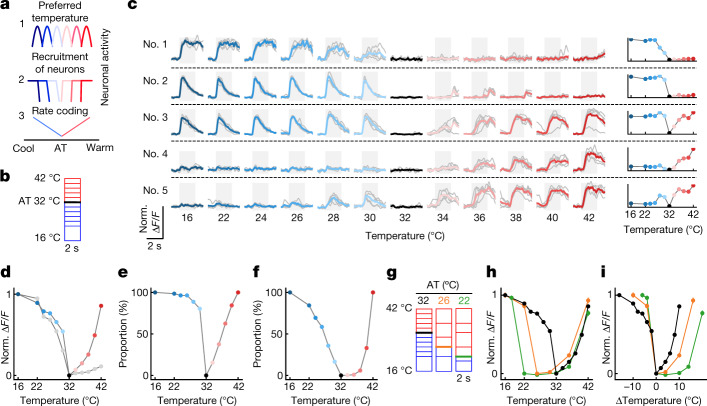
Fig. 4. Relative versus absolute encoding of cooling and warming.
a, Schematic showing three possible cortical thermal coding schemes. Line colours indicate neuronal activity in response to cooling (blue) and warming (red). b, Schematic of stimulus protocol from AT of 32 °C. c, Left: traces of example pIC neurons responding to cooling and warming from AT 32 °C; grey lines show individual trials (5 trials per temperature), and coloured lines show mean response. Right: peak response amplitude plotted as a function of the thermal stimulus for the example neurons on the left. d, Summary of response amplitude plotted as a function of the thermal stimulus for entire population of neurons (n = 746 neurons, 16 sessions, 7 mice). Coloured filled circles (pIC) and grey filled circles (S1) show mean ± s.e.m. at AT 32 °C. e, Same data as in d, but showing the proportion of recruited pIC neurons (>20% of response amplitude). f, Same data as in d, but showing the proportion of pIC neurons reaching maximum response (>80% of response amplitude). g, Schematic of stimulus protocols used to test impact of AT on thermal encoding. h, Graphs as in d, but for pIC neurons at all ATs studied (AT 32 °C, n is same as d; AT 26 °C, n = 401 neurons, 9 sessions, 5 mice; AT 22 °C, n = 448 neurons, 10 sessions, 6 mice). i, Same data as h, but plotted against change in stimulus amplitude.

