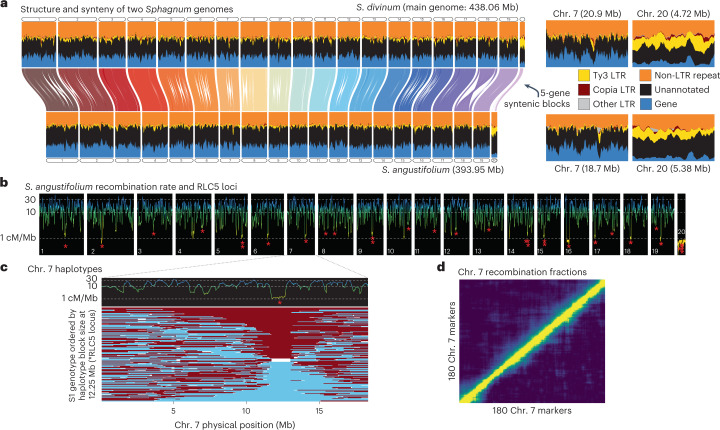
Fig. 1. Comparative genomics of Sphagnum.
a, Syntenic mapping between chromosomes, comparing gene density and repeat content. The orientation of chr. 9 (marked *) is reversed for visualization purposes. Chr. 7 and chr. 20 are duplicated with expanded axes to the right of the main plot to highlight the differences in repeat content. b, S. angustifolium recombination rate (calculated from the S. angustifolium genetic map) with putative centromere positions, denoted with red asterisks showing RLC5 cluster positions. Lines are coloured on the basis of y axis position to better highlight regions of low recombination (yellow) c, Zoomed in look at the RLC5 cluster region on chr. 7. Top panel shows recombination rate from the S. angustifolium genetic map (coloured by position on y axis), showing a drop in recombination coinciding with the RLC5 cluster. Bottom panel shows the recombination haplotypes (maroon and blue) within the F1-haploid pedigree (n = 184; denoted on the y axis), finding no recombined haplotypes in the region overlapping with the RLC5 cluster. d, Recombination/LOD score heatmap for chr. 7 to show high recombination rate in pedigree and tight linkage among markers.

