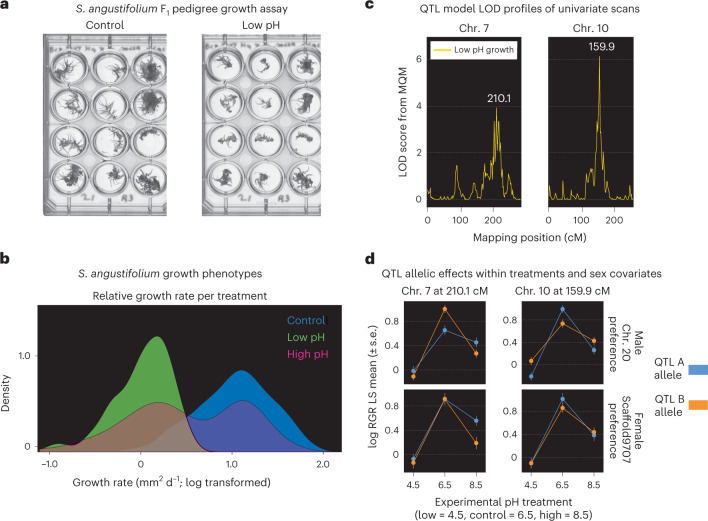
Fig. 5. S. angustifolium pedigree QTL mapping in response to pH stress.
a, Growth of pedigree genotypes under control and acidic stress conditions. b, Relative growth rates for the S. angustifolium pedigree under control, high (pH 8.5) and low (pH 4.5) pH conditions (n = 150). c, QTL mapping of low pH growth differences. Two QTL peaks were detected on chr. 7 and chr. 10. LOD scores, conditional on other QTL in a multiple QTL model, are presented. d, QTL effect plots. The connected line plots (shown with error bars) show the differences in growth for the variant alleles underlying each QTL loci. Each QTL is dependent on sex and autosomal parental allele (blue, A allele; orange, B allele). Panels are ordered by low (pH 4.5), control (pH 6.5) and high (pH 8.5) conditions, with data presented as mean values ± s.e. MQM, multiple QTL mapping; RGR LS, relative growth rate least squares.

