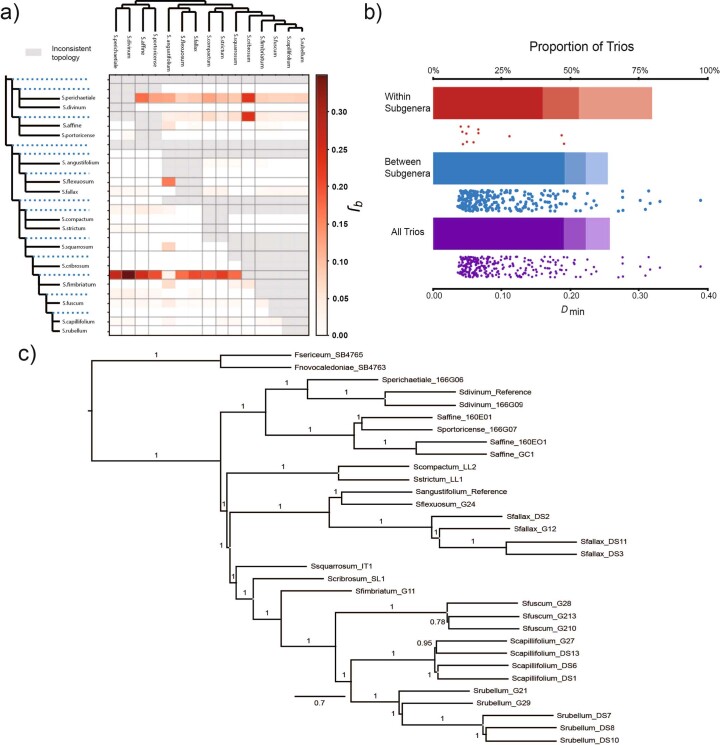
Extended Data Fig. 2. Sphagnum phylogenetics and introgression.
a) Plot of f-branch statistics (fb) showing excess allele sharing between branches of the Sphagnum phylogeny (y-axis) and extant species of Sphagnum (x-axis). Dotted lines on the y-axis represent the most recent common ancestor for branches underneath each line. The maximum likelihood tree generated from 16,171 orthologs was used to calculate the f-branch statistic. Matrix entries colored by f-branch values are significantly different (P<0.05) than zero. Tests that are inconsistent with the given tree topology are shaded in grey. b) Dmin statistics for trios of haploid Sphagnum species (same subgenus, different subgenera, all species) estimated from SNP data. Histograms represent the proportion of trios for which Dmin is significantly different from zero (P<0.05; <0.01; <0.001) based on shading (lightest to darkest, respectively). Dots represent Dmin values for significant trios. c) Phylogenetic relationships of Sphagnum resequencing samples (sample ID appended to species name) estimated from maximum likelihood ortholog genealogies using ASTRAL. Branch support values reflect local posterior probability and branch lengths are in coalescent units.

