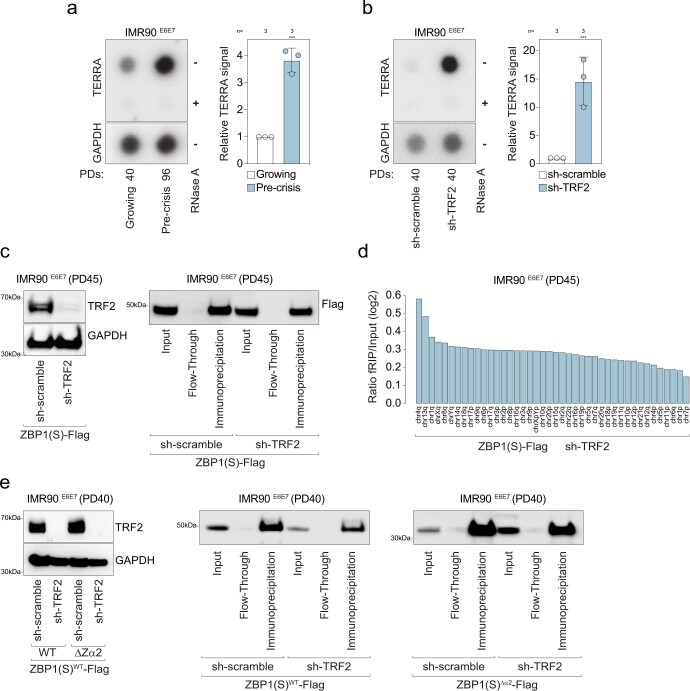
Extended Data Fig. 8. TERRA levels increase upon telomere deprotection.
a, Left: RNA-dot blot performed on RNA isolated from total cell lysates of growing (PD40) and pre-crisis (PD96) IMR90E6E7 using 32P-dCTP-labelled probes targeting either TERRA or GAPDH transcripts. RNase A treatment was used to assess possible DNA contamination. GAPDH loading control. Three independent experiments were performed. Right: Scatter plots with bars showing relative TERRA signal normalized to GAPDH and growing cells. Bars represent mean ± s.d. of biological replicates. n: number of biological replicates. Two-tailed Student’s t-test, *** p < 0.001. Three independent experiments were performed. b, Left: RNA-dot blot performed on RNA isolated from total cell lysates of growing (PD40) IMR90E6E7 expressing non-targeting control shRNA or shRNA against TRF2 using 32P-dCTP-labelled probes targeting either TERRA or GAPDH transcripts. GAPDH loading control. RNA extracts were collected at day 6 post-shRNA transduction. RNase A treatment was used to assess possible DNA contamination. GAPDH loading control. Three independent experiments were performed. Right: Scatter plots with bars showing relative TERRA signals normalized to GAPDH and sh-scramble cells. Bars represent mean ± s.d. of biological replicates. n: number of biological replicates. Two-tailed Student’s t-test, *** p < 0.001. Three independent experiments were performed. c, Left: Immunoblotting of growing (PD45) IMR90E6E7 expressing WT ZBP1(S)-Flag and transduced with non-targeting control shRNA or shRNA against TRF2. Total protein extracts were collected at day 12 post-shRNA transduction. GAPDH loading control. Two independent experiments were performed. Right: Immunoblotting growing (PD45) IMR90E6E7 as in left. Protein extracts were immunoprecipitated with anti-Flag magnetic beads at day 12 post-shRNA transduction. The Input represents total protein extracts, and the Flow-Through represents unbound fractions. d, Column bar graph showing the average ratio fRIP / input (log2) at individual subtelomeres. fRIP and input samples were normalized into the same sequencing depth. Bars represent mean. Two independent experiments were performed. e, Left: Immunoblotting of growing (PD40) IMR90E6E7 expressing either WT ZBP1(S)-Flag or mutant ZBP1(S)-Flag lacking Zα2 transduced with non-targeting control shRNA or shRNA against TRF2. Total protein extracts were collected at day 12 post-shRNA transduction. GAPDH loading control. Three independent experiments were performed. Right: Immunoblotting of growing (PD40) IMR90E6E7 as in left. Protein extracts were immunoprecipitated with anti-Flag magnetic beads at day 12 post-shRNA transduction. The Input represents total protein extracts, and the Flow-Through represents unbound fractions. Three independent experiments were performed. Abbreviations: ZBP1(S): short isoform; Chr: chromosome; WT: wild-type; PDs: population doublings.

