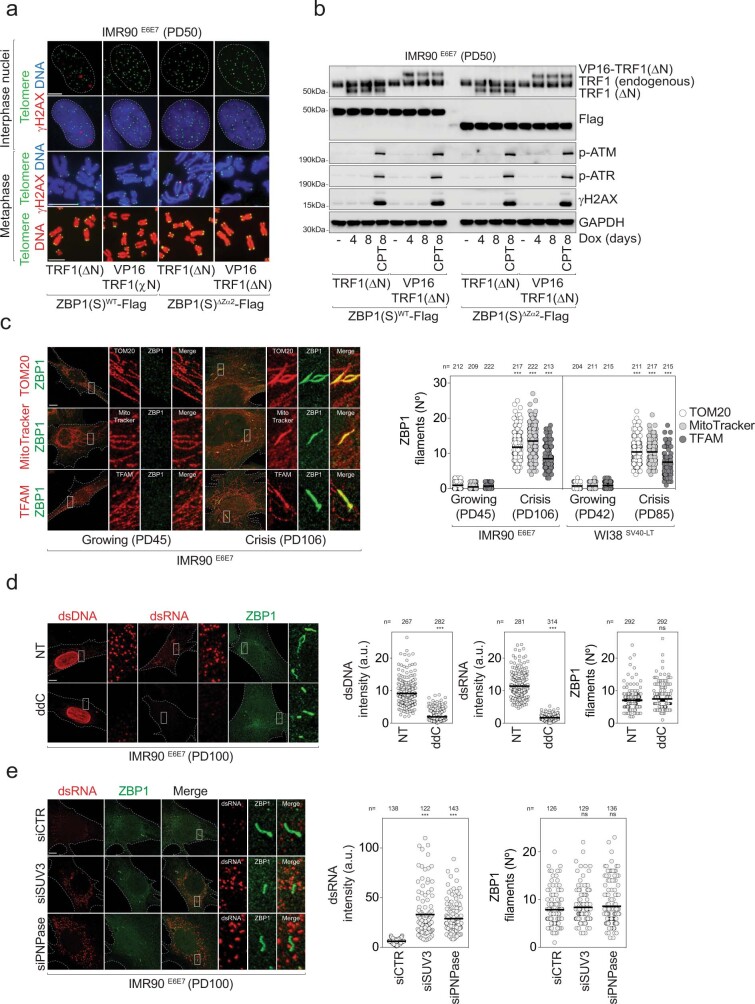
Extended Data Fig. 11. Assembly of ZBP1 filaments at mitochondria does not require sensing of mtDNA or mtRNA.
a, Upper panel: Representative confocal images of growing (PD50) IMR90E6E7 expressing either WT ZBP1(S)-Flag or ZBP1(S)-Flag lacking Zα2 with either TRF1(ΔN) or VP16-TRF1(ΔN). Interphase nuclei were stained with DAPI (blue), telomere FISH (green), and γH2AX immunofluorescence (red). Scale bar 5 μm. Middle panel: Representative fluorescence microscopy images of Metaphase-TIF assays stained with DAPI (blue), telomere FISH (green) and γH2AX immunofluorescence (red). Scale bar 10 μm. Lower panel: Representative fluorescence microscopy images of cytogenetic preparations stained with DAPI (red) and telomere FISH (green). Scale bar 10 μm. Three independent experiments were performed at day 8 post-doxycycline treatment (1 μg ml−1). b, Immunoblotting of cells as in a either untreated or at days 4 and 8 post-doxycycline treatment (1 μg ml−1). Cells treated with 1 µM camptothecin (CPT) for 6 h serve as a positive control. GAPDH loading control. Two independent experiments were performed. c, Left: Representative confocal microscopy images of growing and crisis IMR90E6E7 co-immunostained for endogenous ZBP1 and mitochondrial markers TOM20, TFAM, and MitoTracker at the indicated PDs. Scale bar 10 μm. Right: Scatter plots showing the number of ZBP1 filaments colocalizing with either TOM20, TFAM, or MitoTracker in growing and crisis IMR90E6E7 and WI38SV40LT at the indicated PDs. Centre line: mean. n: number of cells analysed. One-way ANOVA, *** p < 0.001. Three independent experiments were performed. d, Left: Representative confocal microscopy images of crisis (PD100) IMR90E6E7 immunostained with antibodies against endogenous ZBP1, dsDNA, and dsRNA. Cells were incubated with 5 μM of 2’,3’ dideoxycytidine (ddC) for 14 days. Non-treated cells serve as controls. Scale bar 10 μm. Three independent experiments were performed. Right: Scatter plots showing the signal intensity of dsDNA (left), the signal intensity of dsRNA (middle), and the number of ZBP1 filaments (right). Centre line: mean. n: number of cells analysed. Three independent experiments were performed. Two-tailed Student’s t-test, ns: not significant, *** p < 0.001. Three independent experiments were performed. e, Left: Representative confocal microscopy images of growing (PD100) IMR90E6E7 transfected with either non-targeting control siRNA (siCTR), siSUV3, or PNPase, and co-immunostained for endogenous ZBP1 and double-stranded RNA (dsRNA). Experiment was performed at day 7 post-siRNA transfection. Scale bar 10 μm. Three independent experiments were performed. Right: Scatter plots showing the signal intensity of dsRNA (left) and the number of ZBP1 filaments (right). Centre line: mean. n: number of cells analysed. Two-tailed Student’s t-test, ns: not significant, *** p < 0.001. Three independent experiments were performed. Abbreviations: ddC: dideoxycytidine; dsDNA: double-stranded DNA; dsRNA: double-stranded RNA; Mito: mitochondria; WT: wild-type; CTR: control; TIF: telomere-dysfunction-induced foci; FISH: fluorescence in situ hybridization; CPT: camptothecin; WT: wild-type; PDs: population doublings.

