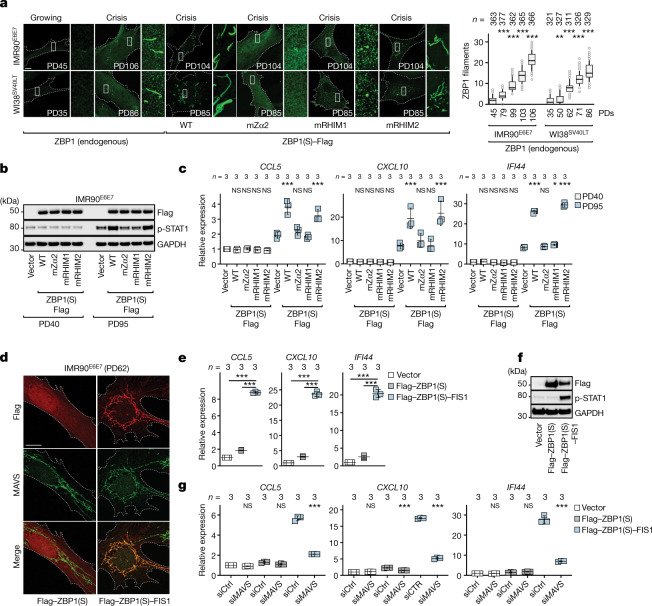
Fig. 4. ZBP1-dependent signalling is mediated by MAVS.
a, Growing and crisis IMR90E6E7 and WI38SV40LT fibroblasts, and crisis IMR90E6E7 and WI38SV40LT fibroblasts expressing WT ZBP1(S)–Flag or ZBP1(S)–Flag containing mutations in Zα2, RHIM1 or RHIM2, immunostained against endogenous ZBP1 or Flag (left). Scale bar, 10 μm. Three independent experiments were performed. Right, box and whisker plots of endogenous ZBP1 filaments. The median (centre line), first and third quartiles (box limits) and 10th and 90th percentiles (whiskers) are shown. n values indicate the cell number. Statistical analysis was performed using one-way ANOVA; **P < 0.01; ***P < 0.001. Three independent experiments were performed. The white boxes indicate higher-magnification images. b, Immunoblot analysis of growing and pre-crisis IMR90E6E7 fibroblasts expressing empty vector, WT ZBP1(S)–Flag or ZBP1(S)–Flag containing domain point mutations. GAPDH was used as the loading control. Two independent experiments were performed. c, RT–qPCR analysis of ISGs in growing and pre-crisis IMR90E6E7 fibroblasts. Expression levels were normalized to growing cells expressing the empty vector. Data are mean ± s.d. of technical replicates. n values indicate the number of technical replicates. Statistical analysis was performed using one-way ANOVA. NS, not significant; ***P < 0.001. Three independent experiments were performed. d, Growing IMR90E6E7 fibroblasts expressing Flag–ZBP1(S) or Flag–ZBP1(S)–FIS1 immunostained for Flag and MAVS. Scale bar, 10 μm. Three independent experiments were performed. e, RT–qPCR analysis of ISGs. RNA extracts were collected 10 days after transduction. Expression levels were normalized to the empty vector. Data are mean ± s.d. from technical replicates. n values indicate the number of technical replicates. Statistical analysis was performed using one-way ANOVA. ***P < 0.001. Three independent experiments were performed. f, Immunoblot analysis of growing IMR90E6E7 fibroblasts as described in e. GAPDH was used as the loading control. Two independent experiments were performed. g, RT–qPCR analysis of ISGs in growing (PD66) IMR90E6E7 fibroblasts. Cells were transfected with siMAVS or non-targeting control siRNA at day 10 after transduction. RNA extracts were collected at day 14. Expression levels were normalized to empty vector siCtrl cells. Data are mean ± s.d. from technical replicates. n values indicate the number of technical replicates. Statistical analysis was performed using one-way ANOVA. NS, not significant; ***P < 0.001. Three independent experiments were performed.

