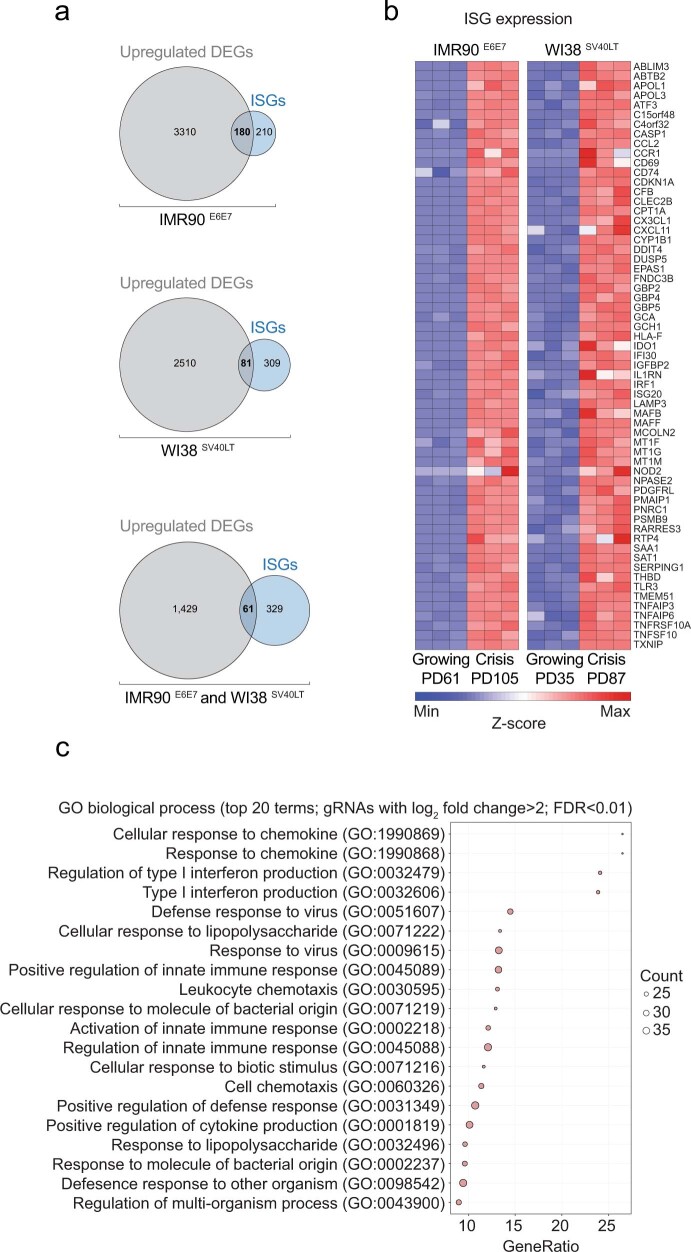
Extended Data Fig. 2. ISGs are induced during crisis.
a, Venn diagram of RNA-sequencing data showing significantly upregulated ISGs in crisis of IMR90E6E7, WI38SV40LT, or both types of fibroblasts as compared with growing cells (PDs are indicated in Extended Data Fig. 1b). Upregulated ISGs with a fold change > 1.5 and false-discovery rate < 0.05 are shown. The complete list of ISGs includes 390 genes and is based on the RNAseq analysis of 5 cell types transfected with 20 viruses from 9 virus classes51. One experiment was performed. b, Heat maps representing RNA-sequencing data of upregulated ISGs (n = 61) in crisis of both types of fibroblasts as in a (lower panel). c, Graphical representation of the enrichment of gene ontology terms for the genome-wide CRISPR/Cas9 knock-out screen. sgRNAs with log2 fold change > 2 are used. The top 20 biological processes are shown. Two independent experiments were performed. Abbreviations: DEGs: differentially expressed genes; sgRNA: single guide RNA; GO: gene ontology; ISGs: interferon stimulated genes, PD: population doubling.

