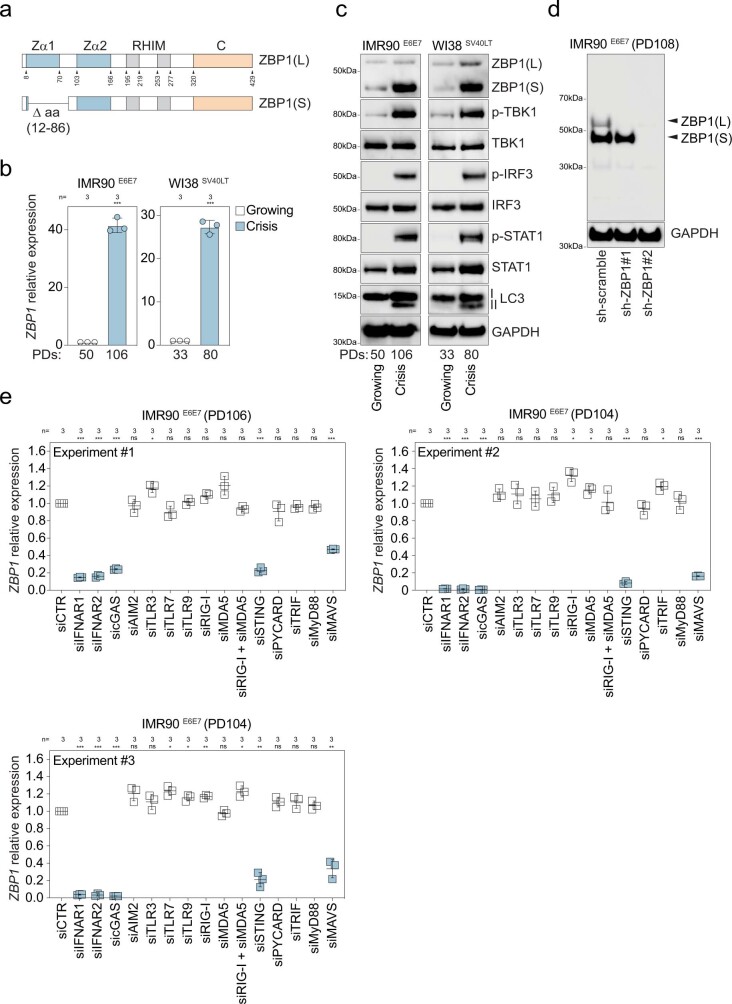
Extended Data Fig. 4. ZBP1(S) levels increase during crisis dependent on cGAS, STING and MAVS.
a, Graphical representation of human ZBP1 protein showing the positions of Zα1, Zα2 and RHIM domains with reference to the two main ZBP1 isoforms, ZBP1(L) and ZBP1(S). b, Scatter plots with bars showing RT-qPCR analysis of ZBP1 in IMR90E6E7 and WI38SV40LT at the indicated PDs. Expression levels were normalized to growing cells. Bars represent mean ± s.d. of technical replicates. n: number of technical replicates. Two-tailed Student’s t-test, *** p < 0.001. Three independent experiments were performed. c, Immunoblotting of IMR90E6E7 and WI38SV40LT at the indicated PDs. GAPDH loading control. Three independent experiments were performed. d, Immunoblotting of crisis (PD108) IMR90E6E7 transduced with two individual lentiviral shRNA vectors targeting either ZBP1(L) by binding to a sequence within the Zα1 or a sequence present in both ZBP1 isoforms. Protein extracts were collected at day 6 post-shRNA transfection. GAPDH loading control. Two independent experiments were performed. e, Scatter plots showing RT-qPCR analysis of ZBP1 in crisis (PD106) IMR90E6E7 transfected with siRNA targeting IFN receptors and main nucleic-acid sensors and adapters. RNA extracts were collected at day 4 post-siRNA transfection. Expression levels were normalized to siCTR cells. Bars represent mean ± s.d. from technical replicates. n: number of technical replicates. One-way ANOVA, ns: not significant, * p < 0.05, ** p < 0.01, *** p < 0.001. Three independent experiments were performed. Abbreviations: ZBP1(L): long isoform; ZBP1(S): short isoform; CTR: control; PDs: population doublings.

