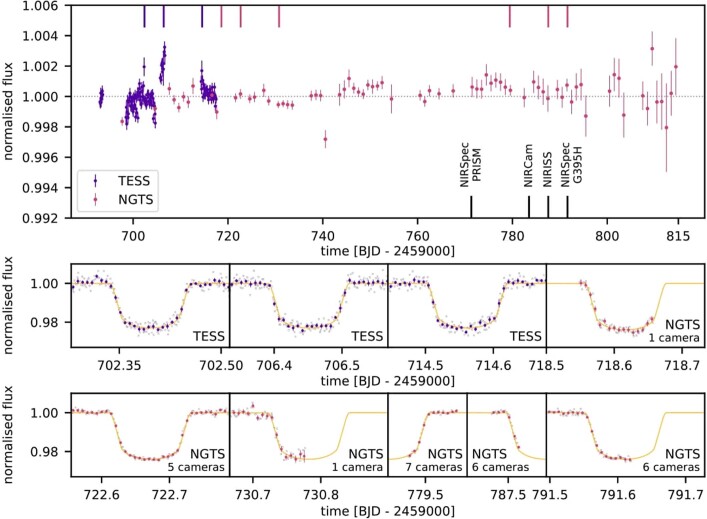
Extended Data Fig. 1. Photometric monitoring of WASP-39 (top) and individual transit observations (bottom) using NGTS (magenta) and TESS (dark purple).
The black marks indicate the times of the four JWST ERS transit observations. The monitoring light curve shows evidence for optical variability, but with an RMS amplitude of only 0.06% in NGTS. The times of the individual transit observations are indicated on the top panel, and they are all consistent with transits free of starspot crossings or other features associated with stellar activity.

