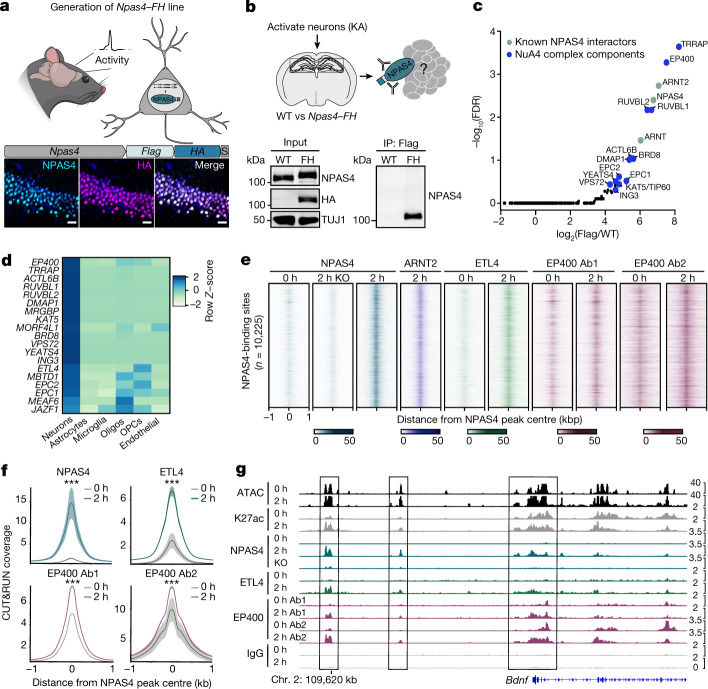
Fig. 1. Neuronal activity assembles the NPAS4–NuA4 complex on chromatin.
a, Top, schematic of generation of the Npas4–FH mouse model. Bottom, representative immunohistochemistry (performed in triplicate) for NPAS4 and HA in hippocampus samples from Npas4–FH mice following 2 h of KA stimulation. Scale bars, 25 µm. b, NPAS4–FH and associated protein complexes isolated by anti-Flag immunoprecipitation (IP). Representative western blot (performed in triplicate) with anti-NPAS4 antibody confirms immunoprecipitation only in Npas4–FH mice. For gel source data, see Supplementary Fig. 1. TUJ1 processing control was run on a separate gel. c, NPAS4-interacting proteins. –log10(false discovery rate (FDR)) compared with log2-transformed fold change in peptides obtained by anti-Flag immunoprecipitation in stimulated Npas4–FH tissue compared with wild-type tissue (n = 3 pools of 8–10 mice), followed by mass spectrometry. Green points indicate known NPAS4 interactors. Blue points indicate NuA4 components. d, Expression levels of NuA4 subunits across cell types in human primary motor cortex, displayed as row Z-score. snRNA-seq data published by the Allen Brain Institute18. Oligos, oligodendrocytes; OPCs, oligodendrocyte precursor cells. e, CUT&RUN signals for NPAS4–NuA4 components in either unstimulated (0 h) or stimulated (2 h) hippocampal tissue. Each NPAS4-binding site is represented as a horizontal line centred at the peak summit and extended ±1 kb. The colour intensity represents the read depth (normalized to 10 million) as indicated by the scale bar for each factor. Data plotted show the aggregate signal from all replicates per factor. Ab1, antibody 1 (Bethyl A300-541-A); Ab2, antibody 2 (Abcam Ab5201). For e–g, n = 3–5 mice pooled per replicate. Replicate numbers provided in Supplementary Table 2. f, Aggregate CUT&RUN coverage (fragment depth per bp per peak) at NPAS4-binding sites. Signals displayed as mean ± s.e.m. ***P < 2.2 × 10⁻¹⁶. P values were calculated from the average signal extracted in a 2 kb window centred on NPAS4 peaks using unpaired, two-tailed Wilcoxon rank-sum tests. g, Integrative Genomics Viewer (IGV) tracks of NPAS4–NuA4 CUT&RUN signal at the activity-inducible gene Bdnf. Data plotted show the aggregate signal from all replicates per factor. The y axis displays normalized coverage scaled for each factor at the chosen locus.

