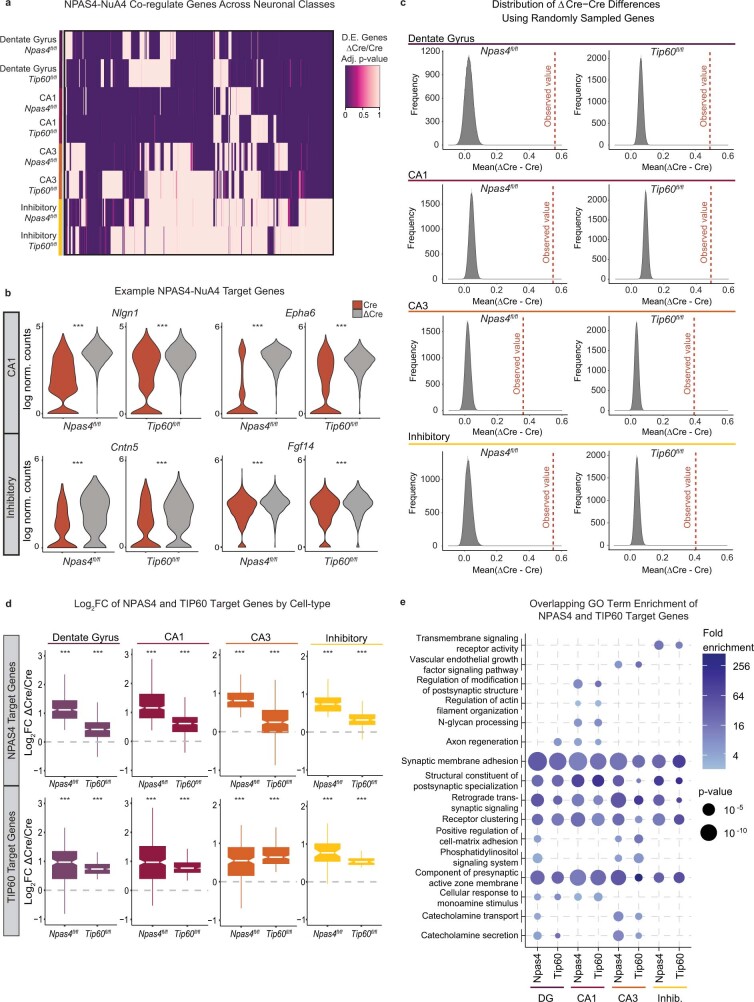
Extended Data Fig. 5. NPAS4-NuA4 coordinate gene regulation across neuronal subtypes in vivo.
a. Heatmap showing coordinate regulation of NPAS4 target genes across the principal neuronal subtypes of the hippocampus in both Npas4fl/fl and Tip60fl/fl mice. NPAS4 target genes were identified in each cell-type using both Seurat (v3) and Monocle3 (see Methods). Bonferroni adjusted P values from Seurat (v3) differential expression testing (unpaired, two-tailed Wilcoxon rank-sum test) between ΔCre- and Cre-infected nuclei are shown in each cell-type. Each column represents adjusted P values for one gene. b. Violin plots showing the distribution of expression (Seurat loge normalized counts) of the indicated gene across nuclei in the indicated cell-type. Bonferroni adjusted P value ***P < 2.2e-16. Differential gene expression tests were conducted using an unpaired, two-tailed Wilcoxon rank-sum test implemented via the Seurat (v3) FindMarkers function. c. Comparison of the observed differences (ΔCre – Cre) in normalized counts for NPAS4 or TIP60 target genes in each neuronal subtype to the differences obtained when using an equal number of randomly selected genes. Genes were randomly selected from the top 10% of expressed genes (to account for NPAS4 or TIP60 target genes being highly expressed on average), and the average difference (ΔCre – Cre) in expression for each gene was calculated for each random sample. This sampling was repeated 10,000 times to generate sampling distributions (gray). In each subtype, the average difference (ΔCre – Cre) observed when using that subtype’s NPAS4 or TIP60 target genes lies far outside the distribution obtained using randomly selected genes, suggesting the differences in expression of the target genes between ΔCre- and Cre-infected nuclei is not due to chance. d. Boxplots showing log2 fold change of NPAS4 or TIP60 target genes (see Methods) comparing ΔCre- and Cre-infected nuclei in dentate gyrus, CA1, CA3, and inhibitory neurons. Boxplot shows median (line), IQR (box), 1.5x IQR (whiskers), notches indicate median ± 1.58× IQR/sqrt(n). *** P < 2.2e-16. P values were calculated using two-tailed, unpaired t-tests comparing to a null hypothesis of log2 fold change = 0 (no difference between Cre and ΔCre). Exact P values and cell numbers per cluster provided in source data. e. Select overlapping GO terms enriched in both NPAS4 target genes and TIP60 target genes across dentate gyrus, CA1, CA3, and inhibitory neurons. Circle size indicates the adjusted P value of enrichment determined by Fisher’s one-tailed test using gProfiler265. Color indicates the fold enrichment. See Methods for additional detail and Supplementary Table 3 for complete list of enriched GO terms for each cell-type.

