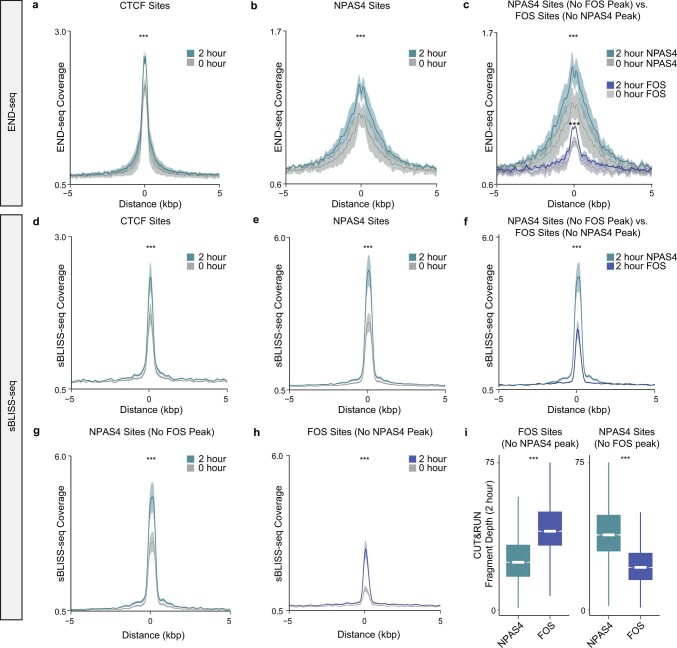
Extended Data Fig. 8. END-seq mapping of DSB signal in cultured cortical neurons shows enrichment at NPAS4-bound sites and activity-dependent dynamics.
a. Aggregate plots (bin size 50 bp) of average END-seq coverage (fragment depth per bp per peak) ± s.e.m. (n = 2) in cultured mouse cortical neurons at CTCF-bound sites (13,228 sites) at either 0 or 2 h of stimulation with 55mM KCl. See Methods for full description of END-seq method and experimental parameters. CTCF-bound sites are defined as sites with a SEACR-defined peak of CTCF CUT&RUN signal in hippocampal datasets. ***P < 2.2e-16. For a-c, replicates consist of independent primary cultures. P values by unpaired, two-tailed Wilcoxon rank-sum tests on signal extracted in a 500 bp window centered on each peak. b. Aggregate plots (bin size 50 bp) of average END-seq coverage ± s.e.m. (n = 2) in cultured mouse cortical neurons at NPAS4-bound sites (10,225 sites) at either 0 or 2 h post stimulation with 55mM KCl. NPAS4-bound sites are defined as sites with a SEACR-defined peak of NPAS4 CUT&RUN in in vivo hippocampal datasets. ***P < 2.2e-16. c. Aggregate plots (bin size 50 bp) of average END-seq coverage ± s.e.m. (n = 2) in cultured mouse cortical neurons at NPAS4 sites that lack a FOS peak (5,550 sites) and FOS sites that lack an NPAS4 peak (6,998 sites), at both 0 and 2 h post stimulation with 55mM KCl. ***P < 2.2e-16 for NPAS4 0 vs 2 h, ***P = 2.3e-15 for FOS 0 vs 2 h. d. Aggregate plots (bin size 50bp) of average sBLISS-seq coverage ± s.e.m. (n = 8) at CTCF-bound sites at 0 and 2 h post stimulation with low-dose KA. ***P < 2.2e-16. For d-h, replicates derived from individual mice. P values by unpaired, two-tailed Wilcoxon rank-sum tests on signal extracted in a 500 bp window centered on each peak. e. Aggregate plots (bin size 50 bp) of average sBLISS-seq coverage ± s.e.m. (n = 8) at NPAS4-bound sites at 0 and 2 h post stimulation. **P < 2.2e-16. f. Aggregate plots (bin size 50 bp) of average sBLISS-seq coverage ± s.e.m. (n = 8) at NPAS4 sites that lack a FOS peak and FOS sites that lack an NPAS4 peak at 2 h post stimulation. ***P < 2.2e-16. g. Aggregate plots (bin size 50 bp) of average sBLISS-seq coverage ± s.e.m. (n = 8) at NPAS4 sites that lack a FOS peak at 0 and 2 h post stimulation. ***P < 2.2e-16. h. Aggregate plots (bin size 50 bp) of average sBLISS-seq coverage ± s.e.m. (n = 8) at FOS sites that lack an NPAS4 peak at 0 and 2 h post stimulation. ***P < 2.2e-16. i. Boxplots showing average NPAS4 (n = 5) and FOS (n = 3) CUT&RUN signal (counts per million) at NPAS4 sites that lack a FOS peak and FOS sites that lack an NPAS4 peak at 2 h post stimulation in hippocampus. 3-5 mice pooled per replicate. Boxplot shows median (line), IQR (box), 1.5x IQR (whiskers), notches indicate median ± 1.58× IQR/sqrt(n). ***P < 2.2e-16. P values were calculated using unpaired, two-tailed Wilcoxon rank-sum tests.

