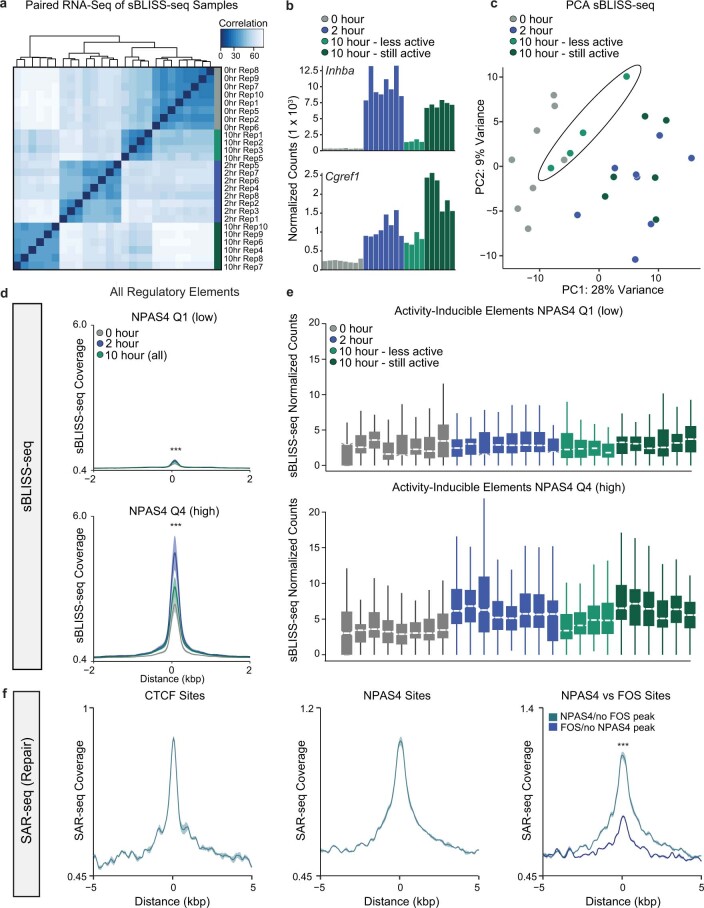
Extended Data Fig. 9. NPAS4-NuA4-bound sites undergo DNA repair as inducible transcription subsides.
a. Heatmap of Euclidean distance between replicates of RNA-seq prepared from the same tissue used to generate the sBLISS-seq timecourse. The samples cluster primarily according to stimulation state, with the 10 h post stimulation samples falling into two groups with either dampening or sustained transcriptional induction. b. DeSeq2 normalized counts of additional inducible genes, Inhba and Cgref1, are shown for each replicate. c. Principal component analysis clustering of sBLISS-seq samples at 0 h, 2 h and 10 h post stimulation. The sBLISS-seq samples cluster according to stimulation state, with the 10 h post stimulation samples clustering either with the 0 h or 2 h samples. Paired RNA-seq analysis indicates that this separation is driven by altered levels of transcriptional induction in these samples. d. Aggregate plots (bin size 50 bp) of average sBLISS-seq coverage (fragment depth per bp per peak) ± s.e.m. at all regulatory elements, subset by quartiles of NPAS4 CUT&RUN signal. Q1 = 44,864 sites, Q4 = 7,378 sites. 0 h (n = 8), 2 h (n = 8), 10 h (n = 10). 1 mouse per replicate. P values were calculated using unpaired, two-tailed Wilcoxon rank sum tests. NPAS4 Q1: 0vs2 h: P < 2.2e-16, 2 vs 10 h: P = 1.7e-15, 0 vs 10 h: P < 2.2e-16; NPAS4 Q4: 0 vs 2 h P < 2.2e-16, 2 vs 10 h: P < 2.2e-16, 0 vs 10 h: P < 2.2e-16. e. Boxplots of sBLISS-seq DeSeq2 normalized counts in 0 h, 2 h, 10 h ‘less active’, and 10 h ‘still active’ samples at activity-inducible regulatory elements, subset by quartiles of NPAS4 binding. Boxplot shows median (line), IQR (box), 1.5x IQR (whiskers), notches indicate median ± 1.58× IQR/sqrt(n). Each boxplot represents an individual replicate consisting of an individual mouse. Boxplots of average signal across all replicates are shown in Fig. 4b. f. Aggregate plots (bin size 50 bp) of average SAR-seq32 coverage ± s.e.m. (n = 3) at CTCF binding sites, all NPAS4 binding sites, and NPAS4 vs FOS binding sites. See Extended Data Fig. 8i for definition of NPAS4 vs FOS binding sites.

