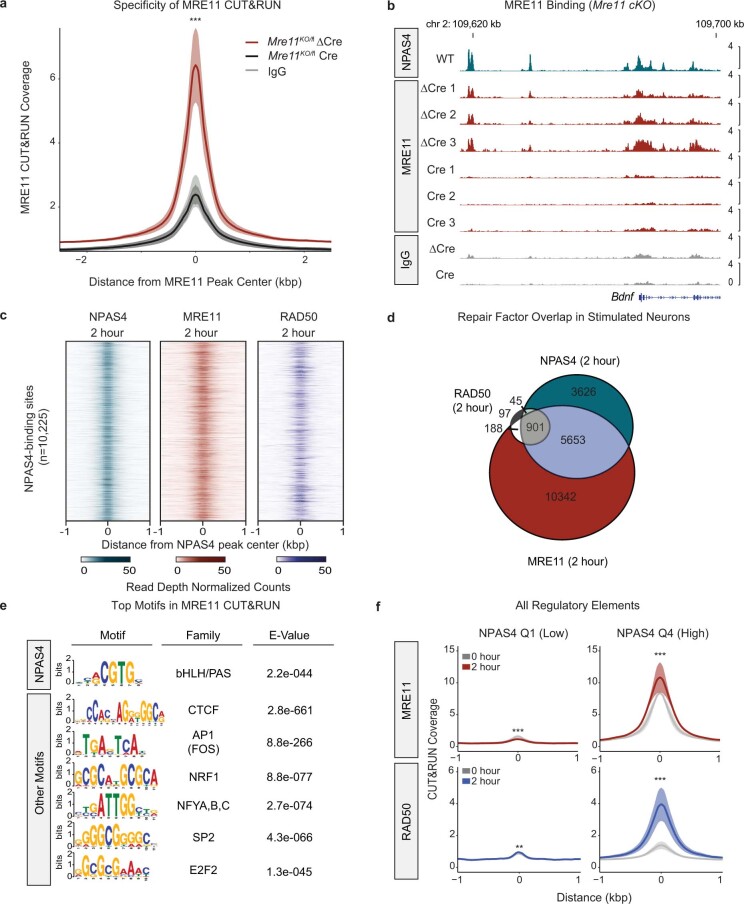
Extended Data Fig. 10. NPAS4-NuA4 co-binds the genome with DNA repair sensors MRE11 and RAD50 in stimulated neurons.
a. Aggregate plot of average MRE11 CUT&RUN coverage (fragment depth per bp per peak) ± s.e.m. in KA-stimulated nuclei isolated from Mre11KO/fl infected with either ΔCre-GFP virus (Control) or Cre-mCherry (Mre11 cKO) at MRE11 binding sites (17,084 sites). MRE11 binding sites were determined by the SEACR peak calling algorithm. IgG indicates the CUT&RUN signal from a nonspecific IgG control and represents the average IgG across both ΔCre-GFP and Cre conditions. MRE11 (n = 3 Cre and n = 3 ΔCre-GFP), IgG (n = 3 Cre and n = 3 ΔCre-GFP). 1 mouse per replicate. ***P < 2.2e-16. P values were calculated using unpaired, two-tailed Wilcoxon rank-sum tests. b. Integrative Genomics Viewer browser image displaying CUT&RUN signal for NPAS4, MRE11 (Cre or ΔCre), and IgG (Cre or ΔCre) in 2 h KA-stimulated nuclei at the Bdnf gene. c. Aggregate CUT&RUN signal for NPAS4, RAD50 and MRE11 in 0 h vs 2 h stimulated hippocampal tissue at NPAS4-binding sites. Each NPAS4-binding site is represented as a single horizontal line centered at the peak summit and extended out ± 1 kb. Intensity of color correlates with sequencing signal as indicated by the scale bar for each factor (0 to 50 read-depth normalization). MRE11(n = 2), RAD50 (n = 4), NPAS4 (n = 5). 3-5 mice pooled per replicate. d. Venn diagram of overlaps between binding sites of MRE11, RAD50 and NPAS4 in 2 h KA-stimulated neurons. Peaks for each factor were determined using the SEACR peak calling algorithm and represent peaks found reproducibly across replicates (2 of 2 MRE11 replicates, 3 of 4 RAD50 replicates, and 4 of 5 NPAS4 replicates). 3-5 mice pooled per replicate. e. Most significant motifs enriched in MRE11 CUT&RUN peaks (2 h KA-stimulated). Motif enrichment was performed on 1 kb peaks extended 500 bp up and downstream from the peak maxima. Notable motifs include the NPAS4/bHLH-PAS motif, the AP1 family, and CTCF motifs. f. Aggregate of average CUT&RUN coverage (fragment depth per bp per peak) ± s.e.m. at all regulatory elements, subset by quartiles of NPAS4 CUT&RUN signal.Q1 = 44,864 sites, Q4 = 7,378 sites. MRE11(0 h and 2 h, n = 2), RAD50 (0 h, n = 3), RAD50 (2 h, n = 4). ***P < 2.2e-16; **P = 5.78e-06. P values by unpaired, two-tailed Wilcoxon rank-sum tests. 3-5 mice pooled per replicate.

